Exam 1: Functions and Limits
Exam 1: Functions and Limits54 Questions
Exam 2: Derivatives50 Questions
Exam 3: Inverse Functions: Exponential, Logarithmic, and Inverse Trigonometric Functions43 Questions
Exam 4: Applications of Differentiation68 Questions
Exam 5: Integrals33 Questions
Exam 6: Techniques of Integration46 Questions
Exam 7: Applications of Integration69 Questions
Exam 8: Series51 Questions
Exam 9: Parametric Equations and Polar Coordinates30 Questions
Exam 10: Vectors and the Geometry of Space68 Questions
Exam 11: Partial Derivatives73 Questions
Exam 12: Multiple Integrals59 Questions
Exam 13: Vector Calculus54 Questions
Select questions type
The graph shown gives the weight of a certain person as a function of age. Find the age at which the person started an exercise program. 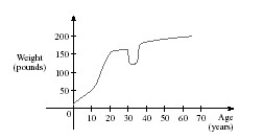
(Multiple Choice)
4.8/5  (29)
(29)
Choose an equation from the following that expresses the fact that a function f is continuous at the number  .
.
(Multiple Choice)
4.8/5 (37)
The relationship between the Fahrenheit and Celsius temperature scales is given by the linear function.  What is the F-intercept and what does it represent?
(Multiple Choice)
4.8/5 (32)
A rectangle has perimeter  m. Express the area of the rectangle as a function
  of the length
  of one of its sides.
(Multiple Choice)
4.9/5 (27)
Use the graph of the function to state the value of  , if it exists.
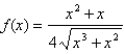
(Multiple Choice)
4.8/5 (40)
Find the domain and sketch the graph of the function. What is its range? f (x) = 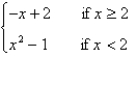
(Multiple Choice)
4.9/5 (31)
Find an expression for the function  whose graph is the bottom half of the parabola
 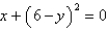 .
.
(Multiple Choice)
5.0/5 (42)
It makes sense that the larger the area of a region, the larger the number of species that inhabit the region. Many ecologists have modeled the species-area relation with a power function and, in particular, the number of species S of bats living in caves in central Mexico has been related to the surface area A measured in  of the caves by the equation
  (a) The cave called mission impossible near puebla, mexico, has suface area of
  .How many species of bats would expect to find in that cave?
(b) If you discover that
.How many species of bats would expect to find in that cave?
(b) If you discover that  species of bats live in cave estimate the area of the cave.
(Short Answer)
5.0/5 (42)
Many physical quantities are connected by inverse square laws, that is, by power functions of the form  .In particular, the illumination of an object by a light source is inversely proportional to the square of the distance from the source. Suppose that after dark you are in a room with just one lamp and you are trying to read a book. The light is too dim and so you move
  the distance to the lamp. How much brighter is the light?
(Multiple Choice)
4.8/5 (36)
The monthly cost of driving a car depends on the number of miles driven. Julia found that in October it cost her  to drive
  mi and in July it cost her
  to drive
  mi. Express the monthly cost C as a function of the distance driven d assuming that a linear relationship gives a suitable model.
(Multiple Choice)
4.8/5 (26)
Filters
- Essay(0)
- Multiple Choice(0)
- Short Answer(0)
- True False(0)
- Matching(0)