Exam 1: Functions and Limits
Exam 1: Functions and Limits54 Questions
Exam 2: Derivatives50 Questions
Exam 3: Inverse Functions: Exponential, Logarithmic, and Inverse Trigonometric Functions43 Questions
Exam 4: Applications of Differentiation68 Questions
Exam 5: Integrals33 Questions
Exam 6: Techniques of Integration46 Questions
Exam 7: Applications of Integration69 Questions
Exam 8: Series51 Questions
Exam 9: Parametric Equations and Polar Coordinates30 Questions
Exam 10: Vectors and the Geometry of Space68 Questions
Exam 11: Partial Derivatives73 Questions
Exam 12: Multiple Integrals59 Questions
Exam 13: Vector Calculus54 Questions
Select questions type
Determine whether the function whose graph is given is even, odd, or neither. 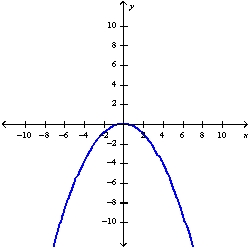
(Multiple Choice)
4.8/5  (34)
(34)
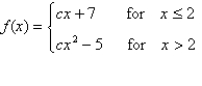
For what value of the constant c is the function f continuous on 
(Multiple Choice)
4.9/5 (23)
The relationship between the Fahrenheit and Celsius temperature scales is given by the linear function.  Complete the table and find the slope.


(Short Answer)
4.8/5 (32)
Estimate the value of the following limit by graphing the function  .
.  Round your answer correct to two decimal places.
(Multiple Choice)
5.0/5 (35)
If the point  is on the graph of an even function, what other point must also be on the graph?
(Multiple Choice)
4.8/5 (35)
Evaluate the function  at the given numbers (correct to six decimal places). Use the results to guess the value of the limit
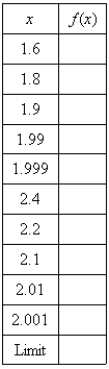
(Short Answer)
4.8/5 (29)
Filters
- Essay(0)
- Multiple Choice(0)
- Short Answer(0)
- True False(0)
- Matching(0)