Exam 51: An Overview of Ecology
Exam 1: Biology and Its Themes46 Questions
Exam 2: Atoms and Molecules61 Questions
Exam 3: The Chemistry of Water55 Questions
Exam 4: Carbon: the Basis of Molecular Diversity52 Questions
Exam 5: Biological Macromolecules and Lipids71 Questions
Exam 6: Energy and Life65 Questions
Exam 7: Cell Structure and Function66 Questions
Exam 8: Cell Membranes67 Questions
Exam 9: Cellular Signaling62 Questions
Exam 10: Cell Respiration68 Questions
Exam 11: Photosynthetic Processes64 Questions
Exam 12: Mitosis63 Questions
Exam 13: Sexual Life Cycles and Meiosis64 Questions
Exam 14: Mendelian Genetics65 Questions
Exam 15: Linkage and Chromosomes54 Questions
Exam 16: Nucleic Acids and Inheritance65 Questions
Exam 17: Expression of Genes70 Questions
Exam 18: Control of Gene Expression66 Questions
Exam 19: Dna Technology56 Questions
Exam 20: The Evolution of Genomes47 Questions
Exam 21: How Evolution Works60 Questions
Exam 22: Phylogenetic Reconstruction66 Questions
Exam 23: Microevolution65 Questions
Exam 24: Species and Speciation65 Questions
Exam 25: Macroevolution58 Questions
Exam 26: Introduction to Viruses54 Questions
Exam 27: Prokaryotes61 Questions
Exam 28: The Origin and Evolution of Eukaryotes66 Questions
Exam 29: Nonvascular and Seedless Vascular Plants72 Questions
Exam 30: Seed Plants64 Questions
Exam 31: Introduction to Fungi56 Questions
Exam 32: An Introduction to Animal Diversity58 Questions
Exam 33: Invertebrates58 Questions
Exam 34: Vertebrates66 Questions
Exam 35: Plant Structure and Growth68 Questions
Exam 36: Transport in Vascular Plants73 Questions
Exam 37: Plant Nutrition51 Questions
Exam 38: Reproduction of Flowering Plants59 Questions
Exam 39: Plant Signals and Behavior60 Questions
Exam 40: The Animal Body58 Questions
Exam 41: Chemical Signals in Animals62 Questions
Exam 42: Animal Digestive Systems58 Questions
Exam 43: Animal Transport Systems58 Questions
Exam 44: Animal Excretory Systems49 Questions
Exam 45: Animal Reproductive Systems64 Questions
Exam 46: Development in Animals68 Questions
Exam 47: Animal Defenses Against Infection65 Questions
Exam 48: Electrical Signals in Animals62 Questions
Exam 49: Neural Regulation in Animals69 Questions
Exam 50: Sensation and Movement in Animals68 Questions
Exam 51: An Overview of Ecology71 Questions
Exam 52: Behavioral Ecology64 Questions
Exam 53: Populations and Life History Traits73 Questions
Exam 54: Biodiversity and Communities71 Questions
Exam 55: Energy Flow and Chemical Cycling in Ecosystems80 Questions
Exam 56: Conservation and Global Ecology75 Questions
Select questions type
Use the following figures to answer the question below. The figure depicts average temperatures and total precipitation across the 12 months of the year. Annual precipitation in Area 1 is approximately 260 cm, and in Area 2, 10 cm. 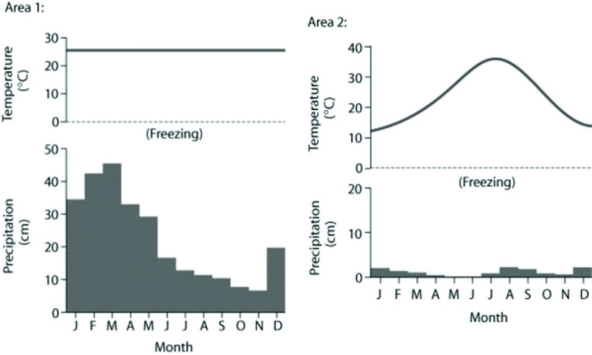 Based on the data in the figures, which of the following statements is most consistent with the data?
(Multiple Choice)
4.9/5  (34)
(34)
Suppose that the number of bird species is determined mainly by the number of vertical strata found in the environment. If so, in which of the following biomes would you find the greatest number of bird species?
(Multiple Choice)
4.9/5 (35)
In areas of permafrost, stands of black spruce are frequently observed in the landscape, while other tree species are noticeably absent. Often these stands are referred to as "drunken forests" because many of the black spruce often "lean over" (that is, they are displaced from their normal vertical alignment). Which of the following best explains the unusual growth of these forests in this marginal habitat?
(Multiple Choice)
4.9/5 (33)
Which of the following statements regarding turnover in a lake is the most accurate?
(Multiple Choice)
4.9/5 (25)
Which of the following explains why seasonal changes, for example, in temperature and/or precipitation, are greater at middle to high latitudes than seasonal changes at equatorial latitudes?
(Multiple Choice)
4.7/5 (32)
Which of the following biotic or abiotic factors limit(s) the range of Saguaro cactus in North America?
(Multiple Choice)
4.9/5 (28)
Which of the following is an important feature of most terrestrial biomes?
(Multiple Choice)
4.8/5 (36)
Which of the following is responsible for the differences in summer and winter temperature stratification of deep temperate zone lakes?
(Multiple Choice)
4.8/5 (37)
Which of the following biomes spans the largest annual mean precipitation range and the narrowest annual mean temperature range?
(Multiple Choice)
4.7/5 (31)
Which of the following types of organisms is likely to have the widest global distribution?
(Multiple Choice)
4.8/5 (45)
North-facing slopes in mountainous areas of western North America would be expected to ________.
(Multiple Choice)
4.7/5 (35)
Which of the following is the most likely effect on climate in the temperate latitudes if Earth were to slow its rate of rotation from a 24-hour period of rotation to a 48-hour period of rotation?
(Multiple Choice)
4.8/5 (31)
The eight panels below show average climatic values across the year on a monthly basis, as represented by first letter of each month depicted on the x-axis. Temperature values are depicted as a line graph and represented by the left vertical axis, while precipitation values are depicted as a bar graph and represented by the right vertical axis. 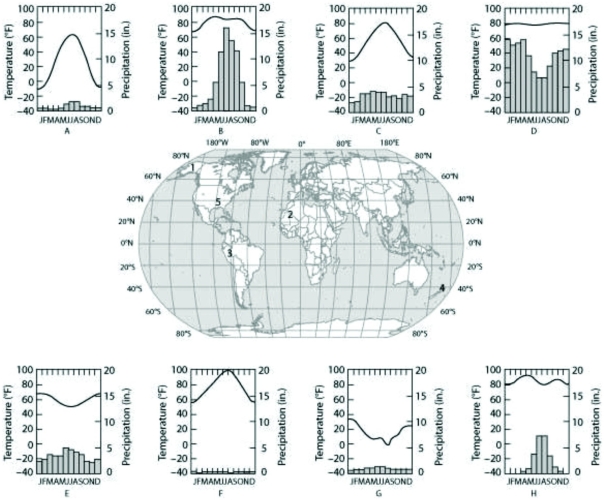 Which panel (A-H) most likely depicts the climate for location 3 as shown on the map in the center panel?
(Multiple Choice)
4.9/5 (39)
Use the following figure to answer the question below. The shaded regions represent the expected climate conditions which give rise to the particular biomes. 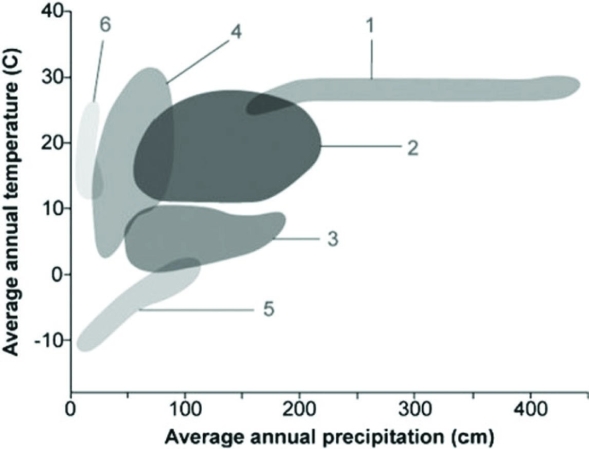 Which shaded region in the figure is the most representative of the biome with the highest variation in annual temperature?
(Multiple Choice)
4.7/5 (41)
Which of the following best represents an investigation of the concept of a microclimate?
(Multiple Choice)
4.8/5 (24)
If an ecologist were studying the regional interactions among multiple populations of different species, and how they influence the exchange of materials between their various environments, which of the following best represents this scale of research?
(Multiple Choice)
4.8/5 (28)
Which of the following would be the most likely result if the Earth's axis were perpendicular to the orbital plane between Earth and the sun?
(Multiple Choice)
4.9/5 (37)
Which of the following is the cause of generalized global air circulation and precipitation patterns?
(Multiple Choice)
4.8/5 (31)
Which of the following statements about light in aquatic environments is the most accurate?
(Multiple Choice)
4.8/5 (41)
Filters
- Essay(0)
- Multiple Choice(0)
- Short Answer(0)
- True False(0)
- Matching(0)