Exam 10: Statistics and Probability
Exam 1: Functions and Graphs362 Questions
Exam 2: Polynomial, Power, and Rational Functions494 Questions
Exam 3: Exponential, Logistic, and Logarithmic Functions350 Questions
Exam 4: Trigonometric Functions522 Questions
Exam 5: Analytic Trigonometry313 Questions
Exam 6: Applications of Trigonometry333 Questions
Exam 7: Systems and Matrices354 Questions
Exam 8: Analytic Geometry in Two and Three Dimensions167 Questions
Exam 9: Discrete Mathematics154 Questions
Exam 10: Statistics and Probability147 Questions
Exam 11: An Introduction to Calculus: Limits, Derivatives, and Integrals167 Questions
Exam 12: Prerequisites382 Questions
Select questions type
Find the probability of the event.
-If two 6-sided dice are rolled, what is the probability that the sum is 4?
(Multiple Choice)
4.9/5  (34)
(34)
Identify whether the number described is a parameter or a statistic.
-A survey of 220 employees of a certain company revealed that 24% of those surveyed were dissatisfied with their jobs.
(Multiple Choice)
4.9/5 (40)
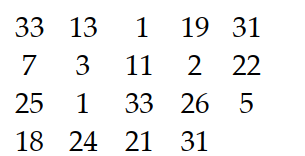
Determine the five-number summary of the given data.
-The National Education Association collects data on the number of years of teaching experience of high-school teachers. A sample taken this year of 19 high-school teachers yielded the following data on number of years of
Teaching experience.
(Multiple Choice)
4.8/5 (36)
Determine the five-number summary of the given data.
-5, 12, 15, 17, 20, 30, 15, 40, 12, 17, 20, 20, 12
(Multiple Choice)
4.9/5 (56)
Find the median for the given sample data.
-2, 3, 8, 21, 30, 30, 49 Find the median for the data.
(Multiple Choice)
4.7/5 (32)
Find the probability.
-The maker of a certain candy claims that the proportions of colors of candy produced are: 0.1 red, 0.1 blue, 0.1 green, 0.1 purple and 0.6 yellow. Suppose a candy is selected randomly from each of two newly-opened
Bags. What is the probability that one is green and the other is blue?
(Multiple Choice)
4.8/5 (38)
Find the probability.
-The maker of a certain candy claims that the proportions of colors of candy produced are: 0.2 red, 0.4 blue, 0.2 green, 0.1 purple and 0.1 yellow. What is the probability that a randomly selected candy from a newly-opened
Bag will be blue or red?
(Multiple Choice)
4.8/5 (29)
Solve the problem.
-A medium-sized company characterized their employees based on the sex of the employee and their length of service to the company. The results are summarized in the table below.
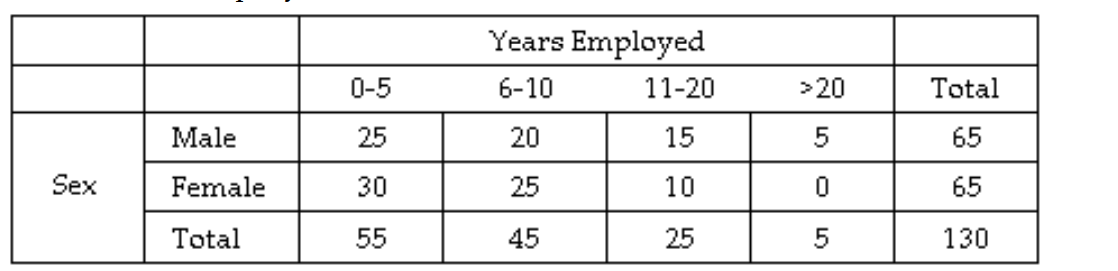 What percentage of the men have worked for the company for more than 10 years?
(Multiple Choice)
4.8/5 (43)
Find the z-score(s) bounding the region in a Normal distribution.
-The 30th percentile
(Multiple Choice)
4.9/5 (37)
Find the mean for the given sample data.
-Six college students spent $150.79, $189.07, $294.93, $206.37, $297.05, and $292.43 respectively for books. Compute the mean amount spent. Round your answer to the nearest cent.
(Multiple Choice)
4.7/5 (34)
Solve the problem.
-The length of time it takes college students to find a parking spot in the library parking lot follows a normal distribution with a mean of 4.5 minutes and a standard deviation of 1 minute. Find the probability that a
Randomly selected college student will find a parking spot in the library parking lot in less than 4.0 minutes.
(Multiple Choice)
4.8/5 (36)
Solve the problem.
-The total distances (in miles) cycled by sixteen athletes in the week prior to a cycling race are shown below. Find the interquartile range.
787 644 820 676
475 603 525 663
568 693 875 501
590 460 562 490
(Multiple Choice)
4.9/5 (46)
Solve the problem.
-A sample of 350 students was selected and each was asked the make of their automobile (foreign or domestic) and their year in college (freshman, sophomore, junior, or senior). The results are shown in the table below.
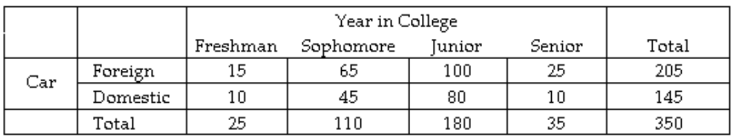 What percent of seniors drive a domestic automobile?
(Multiple Choice)
4.9/5 (40)
Identify the following as an experiment or an observational study.
-A researcher would like to survey a random sample of a town's 1260 eligible voters. He obtains a list of the
eligible voters, numbers the voters alphabetically, and uses the calculator command "randInt(1, 1260, 100)" to
select 100 numbers to correspond to the voters selected.
(Essay)
4.9/5 (35)
Solve the problem.
-Suppose you receive a shipment of 16 calculators, two of which are defective. What is the probability of picking a sample of 5 calculators with exactly one bad calculator in it? (Round approximations to the nearest
Thousandth.)
(Multiple Choice)
4.8/5 (43)
Eleven dimes dated 1989 through 1999 are tossed. Find the probability of the event.
-Exactly 2 heads
(Multiple Choice)
5.0/5 (27)
Determine the five-number summary of the given data.
-50, 52, 61, 61, 61, 61, 63, 63, 66, 67, 67, 69, 71, 72, 73, 75, 78, 80, 82, 83, 88, 88
(Multiple Choice)
4.9/5 (35)
Find the z-score(s) bounding the region in a Normal distribution.
-The middle 96%
(Multiple Choice)
5.0/5 (37)
Determine the five-number summary of the given data.
-The normal annual precipitation (in inches) is given below for 21 different U.S. cities. 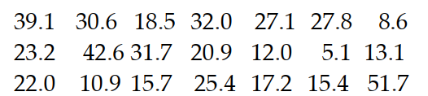
(Multiple Choice)
4.8/5 (37)
Filters
- Essay(0)
- Multiple Choice(0)
- Short Answer(0)
- True False(0)
- Matching(0)