Exam 3: Numerical Descriptive Measures
Exam 1: Introduction118 Questions
Exam 2: Organizing and Visualizing Data210 Questions
Exam 3: Numerical Descriptive Measures143 Questions
Exam 4: Basic Probability171 Questions
Exam 5: Discrete Probability Distributions137 Questions
Exam 6: The Normal Distribution145 Questions
Exam 7: Sampling and Sampling Distributions197 Questions
Exam 8: Confidence Interval Estimation185 Questions
Exam 9: Fundamentals of Hypothesis Testing: One-Sample Tests168 Questions
Exam 10: Two-Sample Tests and One-Way ANOVA293 Questions
Exam 11: Chi-Square Tests108 Questions
Exam 12: Simple Linear Regression213 Questions
Exam 13: Introduction to Multiple Regression291 Questions
Exam 14: Statistical Applications in Quality Management107 Questions
Select questions type
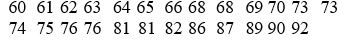
TABLE 3-1
Health care issues are receiving much attention in both academic and political arenas. A sociologist recently conducted a survey of citizens over 60 years of age whose net worth is too high to qualify for Medicaid. The ages of 25 senior citizens were as follows:
 -Referring to Table 3-1, calculate the variance of the ages of the senior citizens correct to the nearest hundredth of a year squared.
(Short Answer)
4.9/5  (39)
(39)
TABLE 3-7
In a recent academic year, many public universities in the United States raised tuition and fees due to a decrease in state subsidies. The change in the cost of tuition, a shared dormitory room, and the most popular meal plan from the previous academic year for a sample of 10 public universities were as follows: $1,589, $593, $1,223, $869, $423, $1,720, $708, $1425, $922 and $308.
-Referring to Table 3-7, what is the standard deviation of the change in the cost?
(Short Answer)
4.8/5 (25)
In a boxplot, the box portion represents the data between the first and third quartile values.
(True/False)
4.8/5 (33)
According to the empirical rule, if the data form a "bell-shaped" normal distribution, ________ percent of the observations will be contained within 1 standard deviation around the arithmetic mean.
(Multiple Choice)
4.9/5 (32)
TABLE 3-4
The ordered array below represents the number of cargo manifests approved by customs inspectors at the Port of New York in a sample of 35 days:
16, 17, 18, 18, 19, 20, 20, 21, 21, 21, 22, 22, 22, 22, 23, 23, 23, 23, 24, 24, 24, 25, 25, 26, 26, 26, 27, 28, 28, 29, 29, 31, 31, 32, 32
Note: For this sample, the sum of the values is 838, and the sum of the squared differences between each value and the mean is 619.89.
-Referring to Table 3-4, the variance of the customs data is ________.
(Short Answer)
4.7/5 (35)
TABLE 3-6
The rate of return of an Internet Service Provider over a 10 year period are:
10.25%, 12.64%, 8.37%, 9.29%, 6.23%, 42.53%, 29.23%, 15.25%, 21.52%, -2.35%.
-Referring to Table 3-6, compute the arithmetic mean rate of return per year.
(Short Answer)
4.8/5 (30)
If the arithmetic mean of a numerical data set is greater than the median, the data are considered to be ________-skewed.
(Short Answer)
4.8/5 (31)
You were told that the 1ˢᵗ, 2ⁿᵈ and 3ʳᵈ quartiles of female students' weight at a major university are 95 lbs, 125 lbs, and 138 lbs. What percentage of the students weigh more than 125 lbs?
(Short Answer)
4.9/5 (35)
The smaller the spread of scores around the arithmetic mean,
(Multiple Choice)
4.8/5 (31)
TABLE 3-5
The rate of return of a Fortune 500 company over the past 15 years are:
3.17%, 4.43%, 5.93%, 5.43%, 7.29%, 8.21%, 6.23%, 5.23%, 4.34%, 6.68%, 7.14%, -5.56%, -5.23%, -5.73%, -10.34%
-Referring to Table 3-5, compute the arithmetic mean rate of return per year.
(Short Answer)
4.8/5 (44)
According to the empirical rule, if the data form a "bell-shaped" normal distribution, ________ percent of the observations will be contained within 3 standard deviations around the arithmetic mean.
(Multiple Choice)
4.9/5 (36)
TABLE 3-2
The data below represent the amount of grams of carbohydrates in a serving of breakfast cereal in a sample of 11 different servings.
11, 15, 23, 29, 19, 22, 21, 20 ,15, 25, 17
-Referring to Table 3-2, the median carbohydrate amount in the cereal is ________ grams.
(Short Answer)
4.8/5 (28)
TABLE 3-6
The rate of return of an Internet Service Provider over a 10 year period are:
10.25%, 12.64%, 8.37%, 9.29%, 6.23%, 42.53%, 29.23%, 15.25%, 21.52%, -2.35%.
-Referring to Table 3-6, construct a boxplot for the rate of return
(Essay)
4.9/5 (31)
TABLE 3-10
Given below are the closing prices for the Dow Jones Industrial Average (DJIA) and the Standard & Poor's (S&P) 500 Index over 10 weeks.
 -Referring to Table 3-10, for the week when the DJIA is high, you will expect the S&P index in that week to
(Multiple Choice)
4.9/5 (25)
TABLE 3-3
The ordered array below represents the number of vitamin supplements sold by a health food store in a sample of 16 days.
19, 19, 20, 20, 22, 23, 25, 26, 27, 30, 33, 34, 35, 36, 38, 41
Note: For this sample, the sum of the values is 448, and the sum of the squared differences between each value and the mean is 812.
-Referring to Table 3-3, the coefficient of variation of the number of vitamin supplements sold in this sample is ________ percent.
(Short Answer)
4.9/5 (33)
TABLE 3-10
Given below are the closing prices for the Dow Jones Industrial Average (DJIA) and the Standard & Poor's (S&P) 500 Index over 10 weeks.
-Referring to Table 3-10, what is the sample correlation coefficient between the DJIA and the S&P 500 Index?
(Short Answer)
4.8/5 (37)
Which descriptive summary measures are considered to be resistant statistics?
(Multiple Choice)
4.9/5 (39)
TABLE 3-9
The population of eight analysts at a software firm were asked to estimate the reuse rate when developing a new software system. The following data are given as a percentage of the total code written for a software system that is part of the reuse database.
50, 62.5, 37.5, 75.0, 45.0, 47.5, 15.0, 25.0
-Referring to Table 3-9, what are the variance and standard deviation of the total code that is part of the reuse database?
(Short Answer)
4.9/5 (40)
Filters
- Essay(0)
- Multiple Choice(0)
- Short Answer(0)
- True False(0)
- Matching(0)