Exam 3: Numerical Descriptive Measures
Exam 1: Introduction118 Questions
Exam 2: Organizing and Visualizing Data210 Questions
Exam 3: Numerical Descriptive Measures143 Questions
Exam 4: Basic Probability171 Questions
Exam 5: Discrete Probability Distributions137 Questions
Exam 6: The Normal Distribution145 Questions
Exam 7: Sampling and Sampling Distributions197 Questions
Exam 8: Confidence Interval Estimation185 Questions
Exam 9: Fundamentals of Hypothesis Testing: One-Sample Tests168 Questions
Exam 10: Two-Sample Tests and One-Way ANOVA293 Questions
Exam 11: Chi-Square Tests108 Questions
Exam 12: Simple Linear Regression213 Questions
Exam 13: Introduction to Multiple Regression291 Questions
Exam 14: Statistical Applications in Quality Management107 Questions
Select questions type
TABLE 3-2
The data below represent the amount of grams of carbohydrates in a serving of breakfast cereal in a sample of 11 different servings.
11, 15, 23, 29, 19, 22, 21, 20 ,15, 25, 17
-Referring to Table 3-2, the interquartile range in the carbohydrate amounts is ________ grams.
(Short Answer)
4.9/5  (41)
(41)
When extreme values are present in a set of data, which of the following descriptive summary measures are most appropriate?
(Multiple Choice)
4.7/5 (40)
TABLE 3-3
The ordered array below represents the number of vitamin supplements sold by a health food store in a sample of 16 days.
19, 19, 20, 20, 22, 23, 25, 26, 27, 30, 33, 34, 35, 36, 38, 41
Note: For this sample, the sum of the values is 448, and the sum of the squared differences between each value and the mean is 812.
-Referring to Table 3-3, the range of the number of vitamin supplements sold in this sample is ________.
(Short Answer)
4.8/5 (35)
TABLE 3-3
The ordered array below represents the number of vitamin supplements sold by a health food store in a sample of 16 days.
19, 19, 20, 20, 22, 23, 25, 26, 27, 30, 33, 34, 35, 36, 38, 41
Note: For this sample, the sum of the values is 448, and the sum of the squared differences between each value and the mean is 812.
-Referring to Table 3-3, the arithmetic mean of the number of vitamin supplements sold in this sample is ________.
(Short Answer)
4.9/5 (42)
TABLE 3-2
The data below represent the amount of grams of carbohydrates in a serving of breakfast cereal in a sample of 11 different servings.
11, 15, 23, 29, 19, 22, 21, 20 ,15, 25, 17
-Referring to Table 3-2, the variance of the carbohydrate amounts is ________ (grams squared).
(Short Answer)
4.8/5 (45)
TABLE 3-12
Energy drink consumption has continued to gain in popularity since the 1997 debut of Red Bull, the current leader in the energy drink market. Given below are the exam scores and the number of 12-ounce energy drinks consumed by 10 college students within a week prior to the exam.
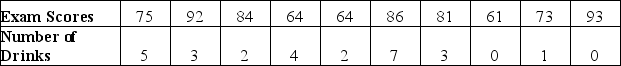 -Referring to Table 3-12, what is the sample correlation coefficient between the exam scores and the number of energy drinks consumed?
(Short Answer)
5.0/5 (36)
TABLE 3-11
Given below are the rating and performance scores of 15 laptop computers.
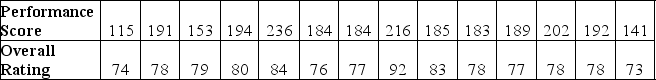 -Referring to Table 3-11, how will you classify the linear relationship between the performance scores and the rating?
(Multiple Choice)
4.8/5 (40)
The interquartile range is a measure of variation or dispersion in a set of data.
(True/False)
4.9/5 (32)
TABLE 3-6
The rate of return of an Internet Service Provider over a 10 year period are:
10.25%, 12.64%, 8.37%, 9.29%, 6.23%, 42.53%, 29.23%, 15.25%, 21.52%, -2.35%.
-Referring to Table 3-6, what is the shape of the distribution for the rate of return?
(Short Answer)
4.8/5 (26)
In a set of numerical data, the value for Q₂ is always halfway between Q₁ and Q₃.
(True/False)
4.8/5 (25)
In general, which of the following descriptive summary measures cannot be easily approximated from a boxplot?
(Multiple Choice)
4.7/5 (39)
TABLE 3-7
In a recent academic year, many public universities in the United States raised tuition and fees due to a decrease in state subsidies. The change in the cost of tuition, a shared dormitory room, and the most popular meal plan from the previous academic year for a sample of 10 public universities were as follows: $1,589, $593, $1,223, $869, $423, $1,720, $708, $1425, $922 and $308.
-Referring to Table 3-7, are the data skewed? If so, how?
(Short Answer)
4.9/5 (38)
TABLE 3-2
The data below represent the amount of grams of carbohydrates in a serving of breakfast cereal in a sample of 11 different servings.
11, 15, 23, 29, 19, 22, 21, 20 ,15, 25, 17
-Referring to Table 3-2, construct a boxplot for the carbohydrate amounts.
(Essay)
4.8/5 (27)
TABLE 3-12
Energy drink consumption has continued to gain in popularity since the 1997 debut of Red Bull, the current leader in the energy drink market. Given below are the exam scores and the number of 12-ounce energy drinks consumed by 10 college students within a week prior to the exam.
-Referring to Table 3-12, what is the sample covariance between the exam scores and the number of energy drinks consumed?
(Short Answer)
4.8/5 (31)
TABLE 3-1
Health care issues are receiving much attention in both academic and political arenas. A sociologist recently conducted a survey of citizens over 60 years of age whose net worth is too high to qualify for Medicaid. The ages of 25 senior citizens were as follows:
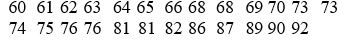 -Referring to Table 3-1, calculate the arithmetic mean age of the senior citizens to the nearest hundredth of a year.
(Short Answer)
5.0/5 (38)
TABLE 3-4
The ordered array below represents the number of cargo manifests approved by customs inspectors at the Port of New York in a sample of 35 days:
16, 17, 18, 18, 19, 20, 20, 21, 21, 21, 22, 22, 22, 22, 23, 23, 23, 23, 24, 24, 24, 25, 25, 26, 26, 26, 27, 28, 28, 29, 29, 31, 31, 32, 32
Note: For this sample, the sum of the values is 838, and the sum of the squared differences between each value and the mean is 619.89.
-Referring to Table 3-4, the median of the customs data is ________.
(Short Answer)
4.7/5 (32)
TABLE 3-10
Given below are the closing prices for the Dow Jones Industrial Average (DJIA) and the Standard & Poor's (S&P) 500 Index over 10 weeks.
 -Referring to Table 3-10, how will you classify the linear relationship between the DJIA and the S&P 500 Index?
(Multiple Choice)
4.9/5 (33)
A manufacturer of flashlight batteries took a sample of 130 batteries from a day's production and used them continuously until they were drained. The number of hours until failure were recorded. Given below is the boxplot of the number of hours it took to drain each of the 130 batteries. The distribution of the number of hours is
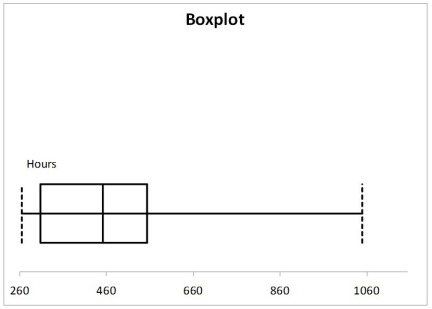
(Multiple Choice)
4.9/5 (41)
TABLE 3-1
Health care issues are receiving much attention in both academic and political arenas. A sociologist recently conducted a survey of citizens over 60 years of age whose net worth is too high to qualify for Medicaid. The ages of 25 senior citizens were as follows:
-Referring to Table 3-1, determine the interquartile range of the ages of the senior citizens.
(Short Answer)
4.8/5 (34)
TABLE 3-10
Given below are the closing prices for the Dow Jones Industrial Average (DJIA) and the Standard & Poor's (S&P) 500 Index over 10 weeks.
-Referring to Table 3-10, you will expect an increase in the DJIA to be associated with
(Multiple Choice)
4.8/5 (40)
Filters
- Essay(0)
- Multiple Choice(0)
- Short Answer(0)
- True False(0)
- Matching(0)