Exam 3: Numerical Descriptive Measures
Exam 1: Introduction118 Questions
Exam 2: Organizing and Visualizing Data210 Questions
Exam 3: Numerical Descriptive Measures143 Questions
Exam 4: Basic Probability171 Questions
Exam 5: Discrete Probability Distributions137 Questions
Exam 6: The Normal Distribution145 Questions
Exam 7: Sampling and Sampling Distributions197 Questions
Exam 8: Confidence Interval Estimation185 Questions
Exam 9: Fundamentals of Hypothesis Testing: One-Sample Tests168 Questions
Exam 10: Two-Sample Tests and One-Way ANOVA293 Questions
Exam 11: Chi-Square Tests108 Questions
Exam 12: Simple Linear Regression213 Questions
Exam 13: Introduction to Multiple Regression291 Questions
Exam 14: Statistical Applications in Quality Management107 Questions
Select questions type
TABLE 3-2
The data below represent the amount of grams of carbohydrates in a serving of breakfast cereal in a sample of 11 different servings.
11, 15, 23, 29, 19, 22, 21, 20 ,15, 25, 17
-Referring to Table 3-2, the standard deviation of the carbohydrate amounts is ________ grams.
(Short Answer)
4.8/5  (34)
(34)
The interquartile range is a measure of central tendency in a set of data.
(True/False)
4.9/5 (42)
The median of a data set with 20 items would be the average of the 10th and the 11th items in the ordered array.
(True/False)
4.8/5 (29)
TABLE 3-11
Given below are the rating and performance scores of 15 laptop computers.
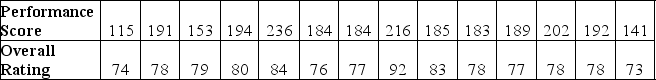 -Referring to Table 3-11, for a laptop computer that has a high rating, you will expect its performance score to
(Multiple Choice)
4.9/5 (32)
TABLE 3-3
The ordered array below represents the number of vitamin supplements sold by a health food store in a sample of 16 days.
19, 19, 20, 20, 22, 23, 25, 26, 27, 30, 33, 34, 35, 36, 38, 41
Note: For this sample, the sum of the values is 448, and the sum of the squared differences between each value and the mean is 812.
-Referring to Table 3-3, the median number of vitamin supplements sold in this sample is ________.
(Short Answer)
4.8/5 (31)
As a general rule, a value is considered an extreme value if its Z score is greater than 3.
(True/False)
4.8/5 (33)
In left-skewed distributions, the distance from the smallest value to Q₁ is greater than the distance from Q₃ to the largest value.
(True/False)
4.8/5 (45)
TABLE 3-10
Given below are the closing prices for the Dow Jones Industrial Average (DJIA) and the Standard & Poor's (S&P) 500 Index over 10 weeks.
 -Referring to Table 3-10, what is the sample covariance between the DJIA and the S&P 500 Index?
(Short Answer)
4.8/5 (31)
TABLE 3-1
Health care issues are receiving much attention in both academic and political arenas. A sociologist recently conducted a survey of citizens over 60 years of age whose net worth is too high to qualify for Medicaid. The ages of 25 senior citizens were as follows:
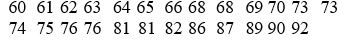 -Referring to Table 3-1 determine the first quartile of the ages of the senior citizens.
(Short Answer)
4.9/5 (35)
TABLE 3-7
In a recent academic year, many public universities in the United States raised tuition and fees due to a decrease in state subsidies. The change in the cost of tuition, a shared dormitory room, and the most popular meal plan from the previous academic year for a sample of 10 public universities were as follows: $1,589, $593, $1,223, $869, $423, $1,720, $708, $1425, $922 and $308.
-Referring to Table 3-7, what is the coefficient of variation of the change in cost?
(Short Answer)
4.7/5 (34)
A population with 200 elements has an arithmetic mean of 10. From this information, it can be shown that the population standard deviation is 15.
(True/False)
4.8/5 (38)
TABLE 3-2
The data below represent the amount of grams of carbohydrates in a serving of breakfast cereal in a sample of 11 different servings.
11, 15, 23, 29, 19, 22, 21, 20 ,15, 25, 17
-Referring to Table 3-2, the range in the carbohydrate amounts is ________ grams.
(Short Answer)
4.9/5 (32)
TABLE 3-2
The data below represent the amount of grams of carbohydrates in a serving of breakfast cereal in a sample of 11 different servings.
11, 15, 23, 29, 19, 22, 21, 20 ,15, 25, 17
-Referring to Table 3-2, the arithmetic mean carbohydrates in this sample is ________ grams.
(Short Answer)
4.8/5 (28)
TABLE 3-4
The ordered array below represents the number of cargo manifests approved by customs inspectors at the Port of New York in a sample of 35 days:
16, 17, 18, 18, 19, 20, 20, 21, 21, 21, 22, 22, 22, 22, 23, 23, 23, 23, 24, 24, 24, 25, 25, 26, 26, 26, 27, 28, 28, 29, 29, 31, 31, 32, 32
Note: For this sample, the sum of the values is 838, and the sum of the squared differences between each value and the mean is 619.89.
-Referring to Table 3-4, the coefficient of variation of the customs data is ________ percent.
(Short Answer)
4.9/5 (26)
TABLE 3-4
The ordered array below represents the number of cargo manifests approved by customs inspectors at the Port of New York in a sample of 35 days:
16, 17, 18, 18, 19, 20, 20, 21, 21, 21, 22, 22, 22, 22, 23, 23, 23, 23, 24, 24, 24, 25, 25, 26, 26, 26, 27, 28, 28, 29, 29, 31, 31, 32, 32
Note: For this sample, the sum of the values is 838, and the sum of the squared differences between each value and the mean is 619.89.
-Referring to Table 3-4, the interquartile range of the customs data is ________.
(Short Answer)
4.7/5 (30)
Which of the arithmetic mean, median, and mode are resistant measures of central tendency?
(Multiple Choice)
4.9/5 (28)
Which of the following is NOT a measure of central tendency?
(Multiple Choice)
4.8/5 (37)
TABLE 3-2
The data below represent the amount of grams of carbohydrates in a serving of breakfast cereal in a sample of 11 different servings.
11, 15, 23, 29, 19, 22, 21, 20 ,15, 25, 17
-Referring to Table 3-2, the first quartile of the carbohydrate amounts is ________ grams.
(Short Answer)
4.7/5 (25)
TABLE 3-8
The following table represents the assets in billions of dollars of the five largest bond funds.
 -Referring to Table 3-8, what are the variance and standard deviation for this population?
(Essay)
4.9/5 (38)
Which measure of central tendency can be used for both numerical and categorical variables?
(Multiple Choice)
4.7/5 (31)
Filters
- Essay(0)
- Multiple Choice(0)
- Short Answer(0)
- True False(0)
- Matching(0)