Exam 4: Describing Bivariate Numerical Data
Exam 1: Collecting Data in Reasonable Ways44 Questions
Exam 2: Graphical Methods for Describing Data Distributions33 Questions
Exam 3: Numerical Methods for Describing Data Distributions32 Questions
Exam 4: Describing Bivariate Numerical Data33 Questions
Exam 5: Probability45 Questions
Exam 6: Random Variables and Probability Distributions57 Questions
Exam 7: Selecting an Appropriate Method4 Questions
Exam 8: Sampling Variability Sampling25 Questions
Exam 9: Estimation Using a Single Sample29 Questions
Exam 10: Asking and Answering Questions About a Population Proportion37 Questions
Exam 11: Asking and Answering Questions About the Difference Between Two Population Proportions22 Questions
Exam 12: Asking and Answering Questions About a Population Mean38 Questions
Exam 13: Asking and Answering Questions About the Difference Between Two Means27 Questions
Exam 14: Learning From Experiment Data8 Questions
Select questions type
The study of prehistoric birds depends on imprints of a prehistoric creature's remains in
stone, commonly known as fossils. To study ancient ecosystems effectively it would be
useful know the actual mass of individual birds, but this information is not preserved in
the fossil record. It seems reasonable that the biomechanics of birds is much the same
today as in the past. For example, today's relationship between the wing length and total
weight of a bird should be very similar to that for birds from the distant past. The wing
lengths of ancient birds are readily obtainable from the fossil record, but the weight is
not. A regression model expressing the relationship between wing length and total
weight of modern birds could be used to estimate the mass of similar prehistoric birds.
Data for some species of modern birds of prey and are given below. Wing length and total weight of modern species of birds of prey
Bird species Wing length () Total weight (kilograms) Gyps fulvus 69.8 7.27 Gypaetus barbatus grandis 71.7 5.39 Catharista atrata 50.2 1.70 Aguila chrysatus 68.2 3.71 Hieraeus fasciatus 56.0 2.06 Helotarsus ecaudatus 51.2 2.10 Geranoatus melanoleucus 51.5 2.12 Circatus gallicus 53.3 1.66 Buteo bueto 40.4 1.03 Pernis apivorus 45.1 0.62 Pandion haliatus 49.6 1.11 Circus aeruginosos 41.3 0.68 Circus cyaneus (female) 37.4 0.472 Circus cyaneus (male) 33.9 0.331 Circus pygargus 35.9 0.237 Circus macrurus 35.7 0.386 Milvus milvus 50.7 0.927
-Biological theory suggests that the 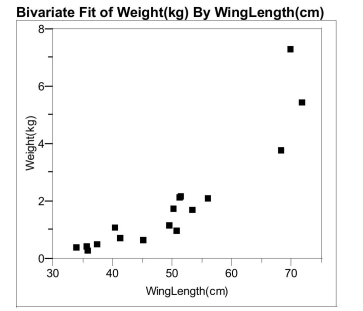 relationship between the weight of these
animals and their wing length could be
modeled using an exponential model.
Perform the appropriate transformation of
variable(s) and fit an exponential model to
the data.
a) What is the resulting best fit line using
the transformed data?
b) What is the predicted log of bird weight for a species with wing length L = 56.0 ?
Show your work below.
relationship between the weight of these
animals and their wing length could be
modeled using an exponential model.
Perform the appropriate transformation of
variable(s) and fit an exponential model to
the data.
a) What is the resulting best fit line using
the transformed data?
b) What is the predicted log of bird weight for a species with wing length L = 56.0 ?
Show your work below.
(Essay)
5.0/5  (47)
(47)
The use of small aircraft with human observers is common in wildlife studies where
the goal is to estimate the abundance of different species. A more economical
strategy might be to use drones. The idea is that a drone would fly over the area of
interest and take photographs for computer analysis. The plot below is from a test run
of drones over 10 areas in South Central Florida. Bird decoys were used to test the
accuracy of the analysis of the photographs. A scatterplot of the actual number of
decoys and the number acquired from applying photographic analysis is shown
below. 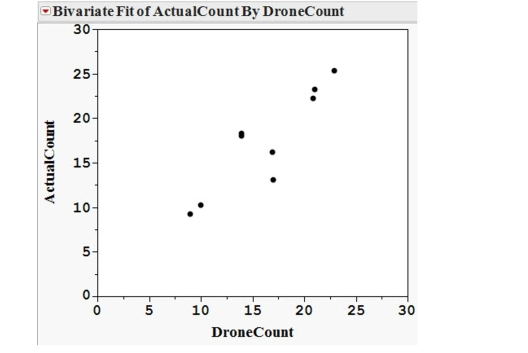 (a) The least squares line is (Drone). Graph this line on the scatterplot above.
(b) The least squares line is the line that minimizes the sum of the squared residuals. Using your line in part (a), graphically represent the residual associated with the drone count of 15 on the scatterplot.
(a) The least squares line is (Drone). Graph this line on the scatterplot above.
(b) The least squares line is the line that minimizes the sum of the squared residuals. Using your line in part (a), graphically represent the residual associated with the drone count of 15 on the scatterplot.
(Essay)
4.9/5 (32)
Does the transformed model appear to be no improvement over the linear model, a
slight improvement, or a significant improvement? Justify your response with an
appropriate statistical argument.
(Essay)
4.7/5 (33)
If on average y increases as x increases, the correlation coefficient is
positive.
(True/False)
4.8/5 (47)
The value of the correlation coefficient, r, is always between 0 and 1.
(True/False)
4.7/5 (28)
The slope of the least squares line is the amount by which y increases, on
average, as x increases by one unit.
(True/False)
4.8/5 (34)
life without their physical capture and handling. In a recent study of
bobcat (Lynx rufus) abundance, camera traps were placed at varying
distances from a road. The data on trapping success from 8 trapping
stations are presented in the table at right. The trapping success is
Remote camera trapping is used to detect and monitor elusive wild- Distance (m) Trap Success 115 2.0 326 1.6 528 2.0 979 1.7 1252 1.9 1252 4.6 1459 5.7 2145 5.4 defined as the number of captures per 100 trap-nights.
-When children are discharged from the hospital their parents may still need to provide
substantial care, such as using a feeding tube. It is difficult for parents to know how
far to insert the tube, especially with rapidly growing infants. Health care
professionals believe it may be possible for parents to measure their child's height
and use a regression equation to calculate the appropriate insertion length. At a major
children's hospital, children and adolescents' heights (H) and esophagus lengths (E)
were measured and a regression analysis performed. The data from this analysis is
summarized below: Summary statistics from Regression Analysis Height and Esophageal Length (cm)
Esophagus Length (E) Height (H) 34 124.5 s 3.5 19
a) For a child with a height one standard deviation above the mean height, what
would be the predicted esophagus length?
b) What proportion of the variability in esophagus length is accounted for by height?
c) From the information presented above, does it appear that the esophagus length
can be accurately predicted from the height of young patients? Provide statistical
evidence for your response.
(Essay)
4.9/5 (37)
A transformation, or re-expression, of a variable is accomplished by
substituting a function of the variable in place of the variable in further
analyses.
(True/False)
5.0/5 (47)
The Des Moines Register reported the ratings of high school sportsmanship as compiled
by the Iowa High School Athletic Association. The participants and coaches from each
school were rated by referees. (1 = superior, 5 = unsatisfactory.) A regression analysis
of data on the average scores given to wrestling spectators and coaches is shown below. Linear Fit
WrestSpectators Wrestlers
Summary of Fit
RSquare 0.467 RSquare Adj 0.465 0.322
Analysis of Variance Source DF SS MS FRatio Model 1 26.437 26.437 254.2274 Error 290 30.157 0.104 Prob > F C. Total 291 56.594 <.0001
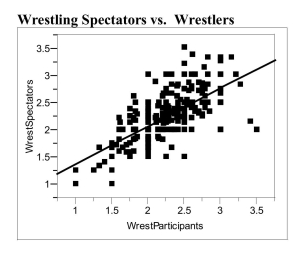 a) Interpret the value of the correlation between the ratings of spectators and
wrestlers?
b) Interpret the value of the coefficient of determination.
c) Interpret the value of the standard deviation about the least squares line.
a) Interpret the value of the correlation between the ratings of spectators and
wrestlers?
b) Interpret the value of the coefficient of determination.
c) Interpret the value of the standard deviation about the least squares line.
(Essay)
4.9/5 (37)
One of the properties of correlation coefficient, r, is: "The value of r does not depend
on the unit of measurement for either variable." In your own words, what does this
mean?
(Essay)
4.8/5 (35)
The standard deviation about the least squares line is roughly the typical
amount by which an observation deviates from the least squares line.
(True/False)
4.8/5 (29)
Filters
- Essay(0)
- Multiple Choice(0)
- Short Answer(0)
- True False(0)
- Matching(0)