Exam 15: Simple Linear Regression and Correlation
Exam 1: What Is Statistics17 Questions
Exam 2: Types of Data, Data Collection and Sampling18 Questions
Exam 3: Graphical Descriptive Techniques Nominal Data17 Questions
Exam 4: Graphical Descriptive Techniques Numerical Data65 Questions
Exam 5: Numerical Descriptive Measures149 Questions
Exam 6: Probability113 Questions
Exam 7: Random Variables and Discrete Probability Distributions50 Questions
Exam 8: Continuous Probability Distributions113 Questions
Exam 9: Statistical Inference and Sampling Distributions69 Questions
Exam 10: Estimation: Describing a Single Population125 Questions
Exam 11: Estimation: Comparing Two Populations36 Questions
Exam 12: Hypothesis Testing: Describing a Single Population124 Questions
Exam 13: Hypothesis Testing: Comparing Two Populations69 Questions
Exam 14: Additional Tests for Nominal Data: Chi-Squared Tests113 Questions
Exam 15: Simple Linear Regression and Correlation213 Questions
Exam 16: Multiple Regression122 Questions
Exam 17: Time-Series Analysis and Forecasting147 Questions
Exam 18: Index Numbers27 Questions
Select questions type
The Spearman rank correlation coefficient must be used to determine whether a relationship exists between two variables when:
(Multiple Choice)
4.8/5  (35)
(35)
In regression analysis, the coefficient of determination, R2, measures the amount of variation in y that is:
(Multiple Choice)
4.8/5 (30)
Predict weekly sales in the fast food restaurant if 5 vouchers are printed in the local newspaper,
given, Estimated Sales = 11.5676 + 0.4618. Vouchers and R2 = 0.7267.
Is this a good estimate?
(Essay)
4.8/5 (34)
An ardent fan of television game shows has observed that, in general, the more educated the contestant, the less money he or she wins. To test her belief, she gathers data about the last eight winners of her favourite game show. She records their winnings in dollars and their years of education. The results are as follows. Contestant Years of education Winnings 1 11 750 2 15 400 3 12 600 4 16 350 5 11 800 6 16 300 7 13 650 8 14 400 Determine the coefficient of determination and discuss what its value tells you about the two variables.
(Essay)
4.8/5 (35)
A professor of economics wants to study the relationship between income y (in $1000s) and education x (in years). A random sample of eight individuals is taken and the results are shown below. Education 16 11 15 8 12 10 13 14 Income 58 40 55 35 43 41 52 49 Compute the standardised residuals.
(Essay)
4.8/5 (37)
An ardent fan of television game shows has observed that, in general, the more educated the contestant, the less money he or she wins. To test her belief, she gathers data about the last eight winners of her favourite game show. She records their winnings in dollars and their years of education. The results are as follows. Contestant Years of education Winnings 1 11 750 2 15 400 3 12 600 4 16 350 5 11 800 6 16 300 7 13 650 8 14 400 Predict with 95% the winnings of all contestants who have 15 years of education.
(Essay)
4.8/5 (31)
We standardise residuals in the same way that we standardise all variables, by subtracting the mean and dividing by the variance.
(True/False)
4.9/5 (40)
The variance of the error variable, , is required to be constant. When this requirement is satisfied, the condition is called homoscedasticity.
(True/False)
4.8/5 (32)
At a recent music concert, a survey was conducted that asked a random sample of 20 people their age and how many concerts they have attended since the beginning of the year. The following data were collected. Age 62 57 40 49 67 54 43 65 54 41 Number of concerts 6 5 4 3 5 5 2 6 3 1 Age 44 48 55 60 59 63 69 40 38 52 Number of Concerts 3 2 4 5 4 5 4 2 1 3 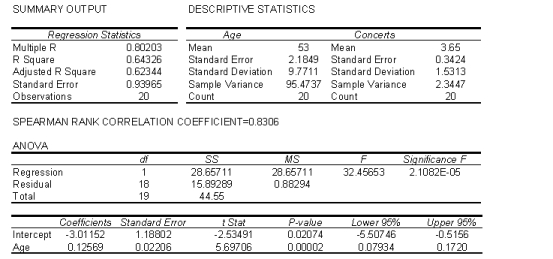 Conduct a test of the population slope to determine at the 5% significance level whether a linear relationship exists between age and number of concerts attended.
(Essay)
4.9/5 (44)
If there is no linear relationship between two variables and , the coefficient of correclation will be zero.
(True/False)
4.9/5 (33)
If the coefficient of correlation is −0.50, the percentage of the variation in the dependent variable y that is explained by the variation in the independent variable x is:
(Multiple Choice)
4.8/5 (31)
Which of the following best describes if we want to test for a linear relationship between x and y, in regression analysis?
(Multiple Choice)
4.8/5 (42)
Given the data points (x,y) = (3,3), (4,4), (5,5), (6,6), (7,7), the least squares estimates of the y-intercept and slope are respectively:
(Multiple Choice)
4.9/5 (32)
If the error variable is normally distributed, the test statistic for testing in a simple linear regression follows the Student t-distribution with n - 1 degrees of freedom.
(True/False)
4.9/5 (31)
The residuals are observations of the error variable . Consequently, the minimised square of deviations is called the sum of squares for error, denoted SSE.
(True/False)
4.7/5 (30)
The following sums of squares are produced: ? = 250, ? = 100, ? = 150.
The percentage of the variation in y that is explained by the variation in x is:
(Multiple Choice)
4.9/5 (37)
In a simple linear regression, which of the following is equivalent to testing the significance of the population slope?
(Multiple Choice)
4.9/5 (33)
Which of the following statements best describes correlation analysis in a simple linear regression?
(Multiple Choice)
4.8/5 (32)
A financier whose specialty is investing in movie productions has observed that, in general, movies with 'big-name' stars seem to generate more revenue than those movies whose stars are less well known. To examine his belief, he records the gross revenue and the payment (in $ million) given to the two highest-paid performers in the movie for 10 recently released movies. Movie Cost of two highest- paid performers (\ ) Gross revenue (\ ) 1 5.3 48 2 7.2 65 3 1.3 18 4 1.8 20 5 3.5 31 6 2.6 26 7 8.0 73 8 2.4 23 9 4.5 39 10 6.7 58 Assume that the conditions for the tests conducted in the previous two questions are not met. Do the data allow us to infer at the 5% significance level that payment to the two highest-paid performers and gross revenue are linearly related?
(Essay)
4.8/5 (37)
Filters
- Essay(0)
- Multiple Choice(0)
- Short Answer(0)
- True False(0)
- Matching(0)