Exam 15: Simple Linear Regression and Correlation
Exam 1: What Is Statistics17 Questions
Exam 2: Types of Data, Data Collection and Sampling18 Questions
Exam 3: Graphical Descriptive Techniques Nominal Data17 Questions
Exam 4: Graphical Descriptive Techniques Numerical Data65 Questions
Exam 5: Numerical Descriptive Measures149 Questions
Exam 6: Probability113 Questions
Exam 7: Random Variables and Discrete Probability Distributions50 Questions
Exam 8: Continuous Probability Distributions113 Questions
Exam 9: Statistical Inference and Sampling Distributions69 Questions
Exam 10: Estimation: Describing a Single Population125 Questions
Exam 11: Estimation: Comparing Two Populations36 Questions
Exam 12: Hypothesis Testing: Describing a Single Population124 Questions
Exam 13: Hypothesis Testing: Comparing Two Populations69 Questions
Exam 14: Additional Tests for Nominal Data: Chi-Squared Tests113 Questions
Exam 15: Simple Linear Regression and Correlation213 Questions
Exam 16: Multiple Regression122 Questions
Exam 17: Time-Series Analysis and Forecasting147 Questions
Exam 18: Index Numbers27 Questions
Select questions type
The regression line Estimated y = 3 + 2x has been fitted to the data points (4,8), (2,5), and (1,2). The sum of the squared residuals will be:
(Multiple Choice)
4.8/5  (28)
(28)
An ardent fan of television game shows has observed that, in general, the more educated the contestant, the less money he or she wins. To test her belief, she gathers data about the last eight winners of her favourite game show. She records their winnings in dollars and their years of education. The results are as follows. Contestant Years of education Winnings 1 11 750 2 15 400 3 12 600 4 16 350 5 11 800 6 16 300 7 13 650 8 14 400 Compute the standardised residuals.
(Essay)
4.9/5 (41)
In simple linear regression, the coefficient of correlation r and the least squares estimate of the population slope :
(Multiple Choice)
4.9/5 (39)
The manager of a fast food restaurant wants to determine how sales in a given week are related to the number of discount vouchers (#) printed in the local newspaper during the week. The number of vouchers and sales ($000s) from 10 randomly selected weeks is given below with Excel regression output. Number of vouchers Sales 4 12.8 7 15.4 5 13.9 3 11.2 19 18.7 10 17.9 8 16.8 6 15.9 3 11.5 5 13.9 SUMMARY OUTPUT RegressionStatistics Multiple R 0.8524 RSquare 0.7267 Adjusted R Square 0.6925 Standard Error 1.4301 Observations 10 ANOvA df SS MS F significance F Regression 1 43.4982 43.4982 21.2682 0.0017 Residual 8 16.3618 2.0452 Total 9 59.8600 Coefficients Standard Error t Stat P-value Lower 95\% Upper 95\% Intercept 11.5676 0.8341 13.6579 0.0000 9.6441 13.4912 Number of vouchers 0.4618 0.1001 4.6117 0.0017 0.2309 0.6927 Test the significance of the slope against a suitable alternative, at the 5% level of significance. Justify your choice of the direction in your alternative hypothesis.
(Essay)
4.9/5 (34)
A television rating wants to determine whether married couples tend to agree about the quality of the television shows they watch. Ten couples are asked to rate a particular comedy series on a 7-point scale where 1 = terrible and 7 = excellent. The results are shown below. Husband's rating 3 6 6 5 4 5 7 4 5 5 Wife's rating 5 5 4 5 4 4 6 3 4 5 Do these data provide sufficient evidence at the 5% significance level to conclude that the husband's and the wife's ratings are positively related?
(Essay)
4.8/5 (35)
In developing a 95% confidence interval for the expected value of y from a simple linear regression problem involving a sample of size 10, the appropriate table value would be 2.306.
(True/False)
4.9/5 (27)
At a recent music concert, a survey was conducted that asked a random sample of 20 people their age and how many concerts they have attended since the beginning of the year. The following data were collected. Age 62 57 40 49 67 54 43 65 54 41 Number of concerts 6 5 4 3 5 5 2 6 3 1 Age 44 48 55 60 59 63 69 40 38 52 Number of Concerts 3 2 4 5 4 5 4 2 1 3  a. Draw a scatter diagram of the data to determine whether a linear model appears to be appropriate to describe the relationship between the age and number of concerts attended by the respondents.
b. Determine the least squares regression line.
c. Plot the least squares regression line.
d. Interpret the value of the slope of the regression line.
a. Draw a scatter diagram of the data to determine whether a linear model appears to be appropriate to describe the relationship between the age and number of concerts attended by the respondents.
b. Determine the least squares regression line.
c. Plot the least squares regression line.
d. Interpret the value of the slope of the regression line.
(Essay)
4.8/5 (32)
Correlation analysis is used to determine the strength of a non-linear relationship between an independent variable x and a dependent variable y.
(True/False)
4.8/5 (26)
Which of the following statements is correct when all the actual values of y are on an upward sloping regression line?
(Multiple Choice)
4.7/5 (38)
In simple linear regression, most often we perform a two-tail test of the population slope to determine whether there is sufficient evidence to infer that a linear relationship exists. Which of the following best describes the null and alternative hypotheses needed for a test of significance?
(Multiple Choice)
4.9/5 (46)
The manager of a fast food restaurant wants to determine how sales in a given week are related to the number of discount vouchers (#) printed in the local newspaper during the week. The number of vouchers and sales ($000s) from 10 randomly selected weeks is given below with Excel regression output. Number of vouchers Sales 4 12.8 7 15.4 5 13.9 3 11.2 19 18.7 10 17.9 8 16.8 6 15.9 3 11.5 5 13.9 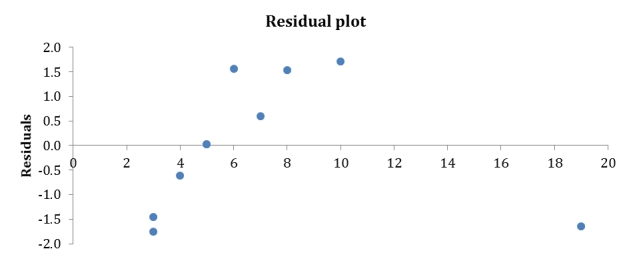 Identify possible outliers.
(Essay)
4.8/5 (35)
The editor of a major academic book publisher claims that a large part of the cost of books is the cost of paper. This implies that larger books will cost more money. As an experiment to analyse the claim, a university student visits the bookstore and records the number of pages and the selling price of 12 randomly selected books. These data are listed below. Book Number of pages Selling price (\ ) 1 844 55 2 727 50 3 360 35 4 915 60 5 295 30 6 706 50 7 410 40 8 905 53 9 1058 65 10 865 54 11 677 42 12 912 58 Determine the least squares regression line.
(Essay)
4.7/5 (35)
A professor of economics wants to study the relationship between income y (in $1000s) and education x (in years). A random sample of eight individuals is taken and the results are shown below. Education 16 11 15 8 12 10 13 14 Income 58 40 55 35 43 41 52 49 Assume that the conditions for the tests conducted in the previous two questions are not met. Do the data allow us to infer at the 5% significance level that years of education and income are linearly related?
(Essay)
4.9/5 (31)
Pop-up coffee vendors have been popular in the city of Adelaide in 2013. A vendor is interested in knowing how temperature (in degrees Celsius) impacts daily hot coffee sales revenue (in $00's).
A random sample of 6 days was taken, with the daily hot coffee sales revenue and the corresponding temperature of that day noted. Coffee sales revenue Temperature 6.50 25 10.00 17 5.50 30 4.50 35 3.50 40 28.00 9 a. Find the least squares regression line.
b. Interpret the slope.
(Essay)
4.9/5 (28)
The smallest value that the standard error of estimate can assume is:
(Multiple Choice)
4.9/5 (26)
On the least squares regression line Estimated y= 2 - 3x, the predicted value of y equals:
(Multiple Choice)
4.9/5 (36)
The manager of a fast food restaurant wants to determine how sales in a given week are related to the number of discount vouchers (#) printed in the local newspaper during the week. The number of vouchers and sales ($000s) from 10 randomly selected weeks is given below with the predicted sales.
Calculate the residuals. Observation Sales Predicted Sales Residuals 1 12.8 13.4147 -0.6147 2 15.4 14.8000 0.6000 3 13.9 13.8765 0.0235 4 11.2 12.9529 -1.7529 5 18.7 20.3412 -1.6412 6 17.9 16.1853 1.7147 7 16.8 15.2618 1.5382 8 15.9 14.3382 1.5618 9 11.5 12.9529 -1.4529 10 13.9 13.8765 0.0235 Compute the standardised residuals.
(Essay)
4.8/5 (34)
An ardent fan of television game shows has observed that, in general, the more educated the contestant, the less money he or she wins. To test her belief, she gathers data about the last eight winners of her favourite game show. She records their winnings in dollars and their years of education. The results are as follows. Contestant Years of education Winnings 1 11 750 2 15 400 3 12 600 4 16 350 5 11 800 6 16 300 7 13 650 8 14 400 Conduct a test of the population slope to determine at the 5% significance level whether a linear relationship exists between TV game show contestants' years of education and their winnings.
(Essay)
4.9/5 (43)
At a recent music concert, a survey was conducted that asked a random sample of 20 people their age and how many concerts they have attended since the beginning of the year. The following data were collected. Age 62 57 40 49 67 54 43 65 54 41 Number of concerts 6 5 4 3 5 5 2 6 3 1 Age 44 48 55 60 59 63 69 40 38 52 Number of Concerts 3 2 4 5 4 5 4 2 1 3 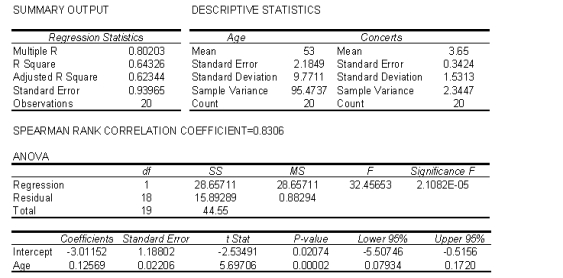 a. Predict with 95% confidence the number of concerts attended by a 45-year-old individual.
b. Predict with 95% confidence the average number of concerts attended by all 45-year-old individuals.
a. Predict with 95% confidence the number of concerts attended by a 45-year-old individual.
b. Predict with 95% confidence the average number of concerts attended by all 45-year-old individuals.
(Essay)
4.8/5 (37)
Another name for the residual term in a regression equation is random error.
(True/False)
5.0/5 (30)
Filters
- Essay(0)
- Multiple Choice(0)
- Short Answer(0)
- True False(0)
- Matching(0)