Exam 5: Numerical Descriptive Measures
Exam 1: What Is Statistics17 Questions
Exam 2: Types of Data, Data Collection and Sampling18 Questions
Exam 3: Graphical Descriptive Techniques Nominal Data17 Questions
Exam 4: Graphical Descriptive Techniques Numerical Data65 Questions
Exam 5: Numerical Descriptive Measures149 Questions
Exam 6: Probability113 Questions
Exam 7: Random Variables and Discrete Probability Distributions50 Questions
Exam 8: Continuous Probability Distributions113 Questions
Exam 9: Statistical Inference and Sampling Distributions69 Questions
Exam 10: Estimation: Describing a Single Population125 Questions
Exam 11: Estimation: Comparing Two Populations36 Questions
Exam 12: Hypothesis Testing: Describing a Single Population124 Questions
Exam 13: Hypothesis Testing: Comparing Two Populations69 Questions
Exam 14: Additional Tests for Nominal Data: Chi-Squared Tests113 Questions
Exam 15: Simple Linear Regression and Correlation213 Questions
Exam 16: Multiple Regression122 Questions
Exam 17: Time-Series Analysis and Forecasting147 Questions
Exam 18: Index Numbers27 Questions
Select questions type
The price-earnings ratios of a sample of stocks have a mean value of 13.5 and a standard deviation of 2. If the ratios have a mound-shaped distribution, what can we say about the proportion of ratios that fall between:
a. 11.5 and 15.5?
b. 9.5 and 17.5?
c. 7.5 and 19.5?
(Essay)
4.9/5  (42)
(42)
In a negatively skewed distribution, the mean is greater than the median.
(True/False)
4.8/5 (33)
The following data represent the ages (in years) of a sample of 25 employees from a government
department: 31 43 56 23 49 42 33 61 44 28 48 38 44 35 40 64 52 42 47 39 53 27 36 35 20 Calculate the 2nd quintile. (Hint: 2nd quintile is L40.)
(Essay)
4.7/5 (42)
The following data represent the weights (in kilograms) of a sample of 30 horses: Weight
165 175 150 155 173 149 145 153 153 153 152 145 164 143 170 175 148 174 171 156 166 168 152 150 173 168 146 155 172 159 Calculate the 3rd and 8th deciles of the data.
(Essay)
5.0/5 (45)
Which of the following must is necessary when approximating descriptive measures for grouped data?
(Multiple Choice)
4.7/5 (34)
In a bell-shaped distribution, there is no difference in the values of the mean, median and mode.
(True/False)
4.7/5 (51)
Which of the following best describes the scenario when two data sets have the same range?
(Multiple Choice)
4.9/5 (40)
The relative frequency histogram for the age (in years) of a sample of 25 employees from a government department, is given below. 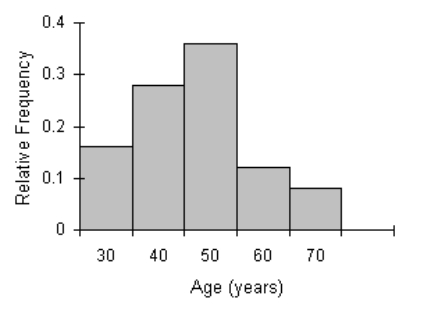 Explain what the best measure of variability is.
(Essay)
4.7/5 (24)
The value of the standard deviation will always exceed that of the variance.
(True/False)
4.9/5 (40)
Consider the following population of measurements: 162 152 177 157 184 176 165 181 170 163 a. Compute the mean.
b. Compute the median.
c. Compute the variance and the standard deviation.
(Essay)
4.7/5 (30)
The following data represent the ages (in years) of a sample of 25 employees from a government
department: 31 43 56 23 49 42 33 61 44 28 48 38 44 35 40 64 52 42 47 39 53 27 36 35 20 Calculate the 4th decile of the data.
(Essay)
4.8/5 (43)
Given the following sample data: x 420 610 625 500 400 450 550 650 480 565 y 2.80 3.60 3.75 3.00 2.50 2.70 3.50 3.90 2.95 3.30
a. calculate the covariance and the correlation coefficient.
b. comment on the relationship between X and Y.
c. determine the least-squares line.
d. draw the scatter diagram and plot the least-squares line.
(Essay)
4.9/5 (29)
Explain the best measure of central location, for each of the following:
a. Method of travelling to work.
b. Average income of university students.
c. Average weight of a 1kg bag of flour.
(Essay)
4.8/5 (41)
The following data represent the salaries (in thousands of dollars) of a sample of 13 employees of a firm: 26.5 23.5 29.7 24.8 21.1 24.3 20.4 22.7 27.2 23.7 24.1 24.8 28.2 Compute the mean salary.
(Short Answer)
4.9/5 (42)
The following data are the heights (in cm) of the 25 students in a business statistics class: 164 148 137 157 173 156 177 172 169 165 145 168 163 162 174 152 156 168 154 151 174 146 134 140 171 a. Compute the sample mean height.
b. Compute the sample variance.
c. Compute the sample standard deviation.
(Essay)
4.8/5 (36)
The mean of a sample of 15 measurements is 35.6. Suppose that the sample is enlarged to 16 measurements, by including one additional measurement having a value of 42. Find the mean of the sample of 16 measurements.
(Short Answer)
4.9/5 (31)
The following data are the heights (in cm) of the 25 students in a business statistics class: 164 148 137 157 173 156 177 172 169 165 145 168 163 162 174 152 156 168 154 151 174 146 134 140 171 Find the median height.
(Short Answer)
4.7/5 (35)
Filters
- Essay(0)
- Multiple Choice(0)
- Short Answer(0)
- True False(0)
- Matching(0)