Exam 5: Numerical Descriptive Measures
Exam 1: What Is Statistics17 Questions
Exam 2: Types of Data, Data Collection and Sampling18 Questions
Exam 3: Graphical Descriptive Techniques Nominal Data17 Questions
Exam 4: Graphical Descriptive Techniques Numerical Data65 Questions
Exam 5: Numerical Descriptive Measures149 Questions
Exam 6: Probability113 Questions
Exam 7: Random Variables and Discrete Probability Distributions50 Questions
Exam 8: Continuous Probability Distributions113 Questions
Exam 9: Statistical Inference and Sampling Distributions69 Questions
Exam 10: Estimation: Describing a Single Population125 Questions
Exam 11: Estimation: Comparing Two Populations36 Questions
Exam 12: Hypothesis Testing: Describing a Single Population124 Questions
Exam 13: Hypothesis Testing: Comparing Two Populations69 Questions
Exam 14: Additional Tests for Nominal Data: Chi-Squared Tests113 Questions
Exam 15: Simple Linear Regression and Correlation213 Questions
Exam 16: Multiple Regression122 Questions
Exam 17: Time-Series Analysis and Forecasting147 Questions
Exam 18: Index Numbers27 Questions
Select questions type
The following data represent the weights (in kilograms) of a sample of 30 horses: Weight
165 175 150 155 173 149 145 153 153 153 152 145 164 143 170 175 148 174 171 156 166 168 152 150 173 168 146 155 172 159 Construct a box plot for the weights.
(Essay)
4.8/5  (37)
(37)
The interquartile range is found by taking the difference between the 1st and 3rd quartiles and dividing that value by 2.
(True/False)
4.8/5 (41)
Chebyshev's theorem applies only to data sets that have a mound-shaped distribution.
(True/False)
4.9/5 (35)
What is wrong with this statement:
"When the sample correlation coefficient is equal to 1 then the slope of the regression line will also be equal to 1".
(Essay)
4.9/5 (33)
The following data represent the salaries (in thousands of dollars) of a sample of 13 employees of a firm: 26.5 23.5 29.7 24.8 21.1 24.3 20.4 22.7 27.2 23.7 24.1 24.8 28.2 Compute the lower quartile.
(Essay)
4.9/5 (33)
The frequency histogram for the heights (in cm) of the 25 students in a business statistics class is given below. 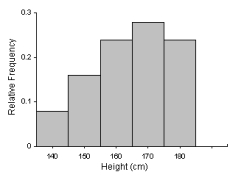 What is the best measure of central location?
(Essay)
4.8/5 (37)
The coefficient of correlation indicates the direction and the strength of the linear relationship between two variables.
(True/False)
4.9/5 (37)
Monthly rent data in dollars for a sample of 10 one-bedroom apartments in Perth are given below: 220 200 230 215 235 250 260 210 265 250 a. Compute the sample monthly average rent.
b. Compute the sample median.
c. What is the mode?
(Essay)
4.8/5 (40)
When approximating descriptive measures for grouped data, the sample mean can be obtained by making the assumption that the midpoint of each class closely approximates the mean of each class.
(True/False)
4.8/5 (36)
A courier company is reviewing their delivery times. The following descriptive statistics relates to this courier company. The mean time for package delivery is 5 hours, the first quartile is 4 hours, the third quartile is 17 hours. This means that the median must lie between 4 hours and 17 hours.
(True/False)
4.7/5 (33)
In a negatively skewed distribution, the mean is smaller than the median and the median is smaller than the mode.
(True/False)
4.7/5 (40)
When a distribution is symmetric, the mean, median and the mode are all equal.
(True/False)
4.9/5 (31)
The mean of fifty sales receipts is $65.75 and the standard deviation is $10.55. Using Chebyshev's theorem, at least 75% of the sales receipts were between $44.65 and $86.85.
(True/False)
4.9/5 (32)
A student scores 87, 73, 92 and 86 on four exams during the semester, and 95 on the final exam. If the final is weighted double and the four others weighted equally, the student's final average would be 88.
(True/False)
4.9/5 (33)
The coefficient of variation is the standard deviation divided by the mean.
(True/False)
4.9/5 (35)
The following data are the heights (in cm) of the 25 students in a business statistics class: 164 148 137 157 173 156 177 172 169 165 145 168 163 162 174 152 156 168 154 151 174 146 134 140 171 a. Construct a box plot for the heights.
b. State the interquartile range and identify any outliers.
c. Compare the information regarding skewness conveyed by your box plot with that shown by a
histogram.
(Essay)
5.0/5 (40)
Which of the following are measures of the linear relationship between two variables?
(Multiple Choice)
4.8/5 (37)
Which of the following best describes the width of the box in the box-and-whisker plot?
(Multiple Choice)
4.9/5 (36)
Filters
- Essay(0)
- Multiple Choice(0)
- Short Answer(0)
- True False(0)
- Matching(0)