Exam 5: Numerical Descriptive Measures
Exam 1: What Is Statistics17 Questions
Exam 2: Types of Data, Data Collection and Sampling18 Questions
Exam 3: Graphical Descriptive Techniques Nominal Data17 Questions
Exam 4: Graphical Descriptive Techniques Numerical Data65 Questions
Exam 5: Numerical Descriptive Measures149 Questions
Exam 6: Probability113 Questions
Exam 7: Random Variables and Discrete Probability Distributions50 Questions
Exam 8: Continuous Probability Distributions113 Questions
Exam 9: Statistical Inference and Sampling Distributions69 Questions
Exam 10: Estimation: Describing a Single Population125 Questions
Exam 11: Estimation: Comparing Two Populations36 Questions
Exam 12: Hypothesis Testing: Describing a Single Population124 Questions
Exam 13: Hypothesis Testing: Comparing Two Populations69 Questions
Exam 14: Additional Tests for Nominal Data: Chi-Squared Tests113 Questions
Exam 15: Simple Linear Regression and Correlation213 Questions
Exam 16: Multiple Regression122 Questions
Exam 17: Time-Series Analysis and Forecasting147 Questions
Exam 18: Index Numbers27 Questions
Select questions type
The following data represent the ages (in years) of a sample of 25 employees from a government
department: 31 43 56 23 49 42 33 61 44 28 48 38 44 35 40 64 52 42 47 39 53 27 36 35 20 Find the coefficient of variation.
(Short Answer)
4.9/5  (27)
(27)
The coefficient of determination lies between 0 and 1 (both inclusive).
(True/False)
4.9/5 (27)
A courier company is reviewing their delivery times. The following descriptive statistics relates to this courier company. The mean time for package delivery is 5 hours, the first quartile is 4 hours, the third quartile is 17 hours. This means that 75% of deliveries take more than 4 hours?
(True/False)
4.7/5 (30)
The frequency histogram for the heights (in cm) of the 25 students in a business statistics class is given below. 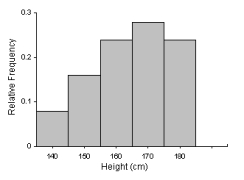 What is the best measure of variability?
(Essay)
4.7/5 (33)
The following data represent the weights (in kilograms) of a sample of 30 horses: Weight
165 175 150 155 173 149 145 153 153 153 152 145 164 143 170 175 148 174 171 156 166 168 152 150 173 168 146 155 172 159 Compute the sample mean weight.
(Short Answer)
4.8/5 (33)
The coefficient of variation allows us to compare two sets of data based on different measurement units.
(True/False)
4.9/5 (42)
Which of the following would be the value of the correlation coefficient of two variables which are not linearly related.
(Multiple Choice)
4.9/5 (37)
The coefficient of correlation is the covariance between the two variables divided by the standard deviations of the two variables.
(True/False)
4.8/5 (40)
The following data represent the ages (in years) of a sample of 25 employees from a government
department: 31 43 56 23 49 42 33 61 44 28 48 38 44 35 40 64 52 42 47 39 53 27 36 35 20 Compute the range approximation to the standard deviation of the data. (Hint: S Range
(Essay)
4.7/5 (36)
Data were obtained for the weight in grams, of a sample of 10 packets of sweetener, as found in cafés. 4.5 5 5.9 5.4 5.5 4.7 4.9 4.7 4.7 4.6 Find the standard deviation.
(Short Answer)
4.8/5 (42)
The following data represent the numbers of bedrooms in a sample of 10 suburban houses in Mel-bourne:
3 3 2 2 4 5 2 5 4 2
Use these data to answer the following question/s.
-Compute the coefficient of variation.
(Short Answer)
4.8/5 (38)
The following data represent the weights (in kilograms) of a sample of 30 horses: Weight
165 175 150 155 173 149 145 153 153 153 152 145 164 143 170 175 148 174 171 156 166 168 152 150 173 168 146 155 172 159 Determine the location and value of the lower quartile of the weights.
(Short Answer)
4.9/5 (34)
The annual percentage rates of return over the past 10 years for two mutual funds are as follows: Fund A: 7.1 -7.4 19.7 -3.9 32.4 41.7 23.2 4.0 1.9 29.3 Fund B: 10.8 -4.1 5.1 10.9 26.5 24.0 16.9 9.4 -2.6 10.1 Which fund would you classify as having the higher level of risk?
(Essay)
4.9/5 (35)
The following data represent the ages (in years) of a sample of 25 employees from a government
department: 31 43 56 23 49 42 33 61 44 28 48 38 44 35 40 64 52 42 47 39 53 27 36 35 20 Construct a box plot for the age data and identify any outliers.
(Essay)
4.8/5 (43)
The difference between the largest and smallest values in an ordered array is called the range.
(True/False)
4.8/5 (31)
A sample of eight observations of variables x and y is shown below: x 5 3 7 9 2 4 6 8 y 20 23 15 11 27 21 17 14 Draw the scatter diagram and plot the least-squares line.
(Essay)
4.8/5 (32)
The following data represent the ages (in years) of a sample of 25 employees from a government
department: 31 43 56 23 49 42 33 61 44 28 48 38 44 35 40 64 52 42 47 39 53 27 36 35 20 Compute the sample variance and sample standard deviation.
(Essay)
4.8/5 (36)
Which of the following is the best measure of variability if the distribution of a set of data is skewed?
(Multiple Choice)
4.9/5 (47)
The following data represent the salaries (in thousands of dollars) of a sample of 13 employees of a firm: 26.5 23.5 29.7 24.8 21.1 24.3 20.4 22.7 27.2 23.7 24.1 24.8 28.2 Compute the variance and standard deviation of the salaries.
(Essay)
4.8/5 (44)
Filters
- Essay(0)
- Multiple Choice(0)
- Short Answer(0)
- True False(0)
- Matching(0)