Exam 2: Frequency Distributions and Graphs
Exam 1: The Nature of Probability and Statistics53 Questions
Exam 2: Frequency Distributions and Graphs79 Questions
Exam 3: Data Description98 Questions
Exam 5: Discrete Probability Distributions75 Questions
Exam 6: The Normal Distribution81 Questions
Exam 7: Confidence Intervals and Sample Size74 Questions
Exam 8: Hypothesis Testing86 Questions
Exam 9: Testing the Difference Between Two Means, Two Variances, and Two Proportions73 Questions
Exam 10: Correlation and Regression78 Questions
Exam 11: Other Chi-Square Tests69 Questions
Exam 12: Analysis of Variance71 Questions
Exam 13: Nonparametric Statistics87 Questions
Exam 14: Sampling and Simulation67 Questions
Select questions type
Using the following frequency distribution, construct a frequency
polygon. 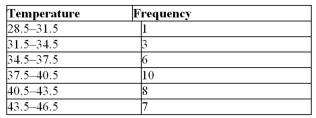
(Essay)
4.9/5  (39)
(39)
A histogram is a graph that represents the cumulative frequencies for the classes in a frequency
distribution.
(True/False)
4.9/5 (34)
The lower class limit represents the smallest data value that can be included in the class.
(True/False)
4.8/5 (40)
Which of the following should not be done when constructing a frequency distribution?
(Multiple Choice)
4.7/5 (45)
The rate of mortality of children is very high in the first weeks of life.It then decreases rapidly until 1 or
2 years of age and then increases slowly into the teen years.In this situation one should construct relative
frequency distributions (per year of age) with narrow class widths during the first year of life so as to
exhibit the quickly changing mortality rate.
(True/False)
4.8/5 (24)
The cumulative frequency is the sum of the frequencies accumulated to the upper boundary of a class in
the distribution.
(True/False)
4.8/5 (42)
For the numbers -5, -2, -7, and 0, which of the following that includes all four is a good class?
(Multiple Choice)
4.9/5 (40)
A frequency polygon and a histogram have the same overall shape.
(True/False)
4.8/5 (29)
The frequency polygon is a graph that displays the data by using lines that connect points plotted for the
frequencies at the midpoints of the classes.
(True/False)
4.7/5 (44)
A pie graph is not useful to show which of the following characteristics of data?
(Multiple Choice)
4.9/5 (35)
A stem and leaf plot is useful for keeping more precision than a grouped frequency distribution.
(True/False)
4.9/5 (34)
The graphs that have their distributions as proportions instead of raw data as frequencies are called
(Multiple Choice)
4.8/5 (39)
Filters
- Essay(0)
- Multiple Choice(0)
- Short Answer(0)
- True False(0)
- Matching(0)