Exam 2: Frequency Distributions and Graphs
Exam 1: The Nature of Probability and Statistics53 Questions
Exam 2: Frequency Distributions and Graphs79 Questions
Exam 3: Data Description98 Questions
Exam 5: Discrete Probability Distributions75 Questions
Exam 6: The Normal Distribution81 Questions
Exam 7: Confidence Intervals and Sample Size74 Questions
Exam 8: Hypothesis Testing86 Questions
Exam 9: Testing the Difference Between Two Means, Two Variances, and Two Proportions73 Questions
Exam 10: Correlation and Regression78 Questions
Exam 11: Other Chi-Square Tests69 Questions
Exam 12: Analysis of Variance71 Questions
Exam 13: Nonparametric Statistics87 Questions
Exam 14: Sampling and Simulation67 Questions
Select questions type
A time series graph is useful for which of the following purposes?
(Multiple Choice)
4.8/5  (39)
(39)
Given the following frequency distribution, how many pieces of data were less than 28.5? 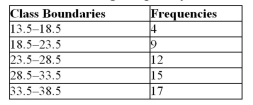
(Multiple Choice)
4.9/5 (37)
Exaggerating a one-dimensional increase by showing it in two dimensions is an example of a(n)
(Multiple Choice)
4.8/5 (38)
A grouped frequency distribution is used when the range of the data values is relatively small.
(True/False)
4.9/5 (36)
The __________ is obtained by first adding the lower and upper limits and then dividing by 2.
________________________________________
(Short Answer)
4.8/5 (41)
Which of the following could be a cumulative frequency graph?
(Multiple Choice)
4.8/5 (43)
A pie graph would best represent the number of inches of rain that has fallen in Thunder Bay, Ontario
each day for the past 2 months.
(True/False)
4.8/5 (40)
A Pareto chart arranges data from largest to smallest according to frequencies.
(True/False)
4.9/5 (37)
If a frequency distribution had class boundaries of 132.5-147.5, what would be the class width?
(Short Answer)
4.8/5 (39)
A histogram uses the midpoints for the x values and the frequencies as the y values.
(True/False)
4.9/5 (45)
In a pie graph, if pepperoni pizza were 24/72 of the distribution, how many degrees would be needed to represent pepperoni?
(Multiple Choice)
5.0/5 (40)
If the limits for a class were 20-38, the boundaries would be 19.5-38.5.
(True/False)
4.9/5 (39)
The percentage of white, wheat, and rye bread sold at a supermarket each week is best shown using a
__________ graph
________________________________________
(Short Answer)
4.9/5 (36)
Which graph should be used to represent the frequencies that certain types of classes are taken at Sir Robert Borden High School?
(Multiple Choice)
4.9/5 (34)
When two sets of data are compared on the same graph using two lines, it is called a compound time
series graph.
(True/False)
4.8/5 (36)
Filters
- Essay(0)
- Multiple Choice(0)
- Short Answer(0)
- True False(0)
- Matching(0)