Exam 17: Business Analytics
Exam 1: Defining and Collecting Data207 Questions
Exam 2: Organizing and Visualizing Variables213 Questions
Exam 3: Numerical Descriptive Measures167 Questions
Exam 4: Basic Probability171 Questions
Exam 5: Discrete Probability Distributions217 Questions
Exam 6: The Normal Distributions and Other Continuous Distributions189 Questions
Exam 7: Sampling Distributions135 Questions
Exam 8: Confidence Interval Estimation189 Questions
Exam 9: Fundamentals of Hypothesis Testing: One-Sample Tests187 Questions
Exam 10: Two-Sample Tests208 Questions
Exam 11: Analysis of Variance216 Questions
Exam 12: Chi-Square and Nonparametric Tests178 Questions
Exam 13: Simple Linear Regression214 Questions
Exam 14: Introduction to Multiple Regression336 Questions
Exam 15: Multiple Regression Model Building99 Questions
Exam 16: Time-Series Forecasting173 Questions
Exam 17: Business Analytics115 Questions
Exam 18: A Roadmap for Analyzing Data329 Questions
Exam 19: Statistical Applications in Quality Management Online162 Questions
Exam 20: Decision Making Online129 Questions
Exam 21: Understanding Statistics: Descriptive and Inferential Techniques39 Questions
Select questions type
The forward-and-backward computation among the three layers of a multilayer perceptron is repeated until the output layer detects that the difference between the predicted results and the target values has been minimized or is at an acceptable level.
Free
(True/False)
4.9/5  (35)
(35)
Correct Answer: Verified
True
In multidimensional scaling, the Euclidean distance is most commonly used to measure the distance between objects.
Free
(True/False)
4.8/5 (30)
Correct Answer:Verified
True
SCENARIO 17-6 The neural network output below was obtained for predicting the weekend box office revenue of a newly released movie (in thousands of dollars)based on data collected in different cities on the expenditure (at $25, $30, $35, $40, $45, $50, $55, $60 $65 or $70 thousands)spent on TV advertising and the number of times (10, 15, 20, 25, 30 or 35)a day the advertisement appear on TV. 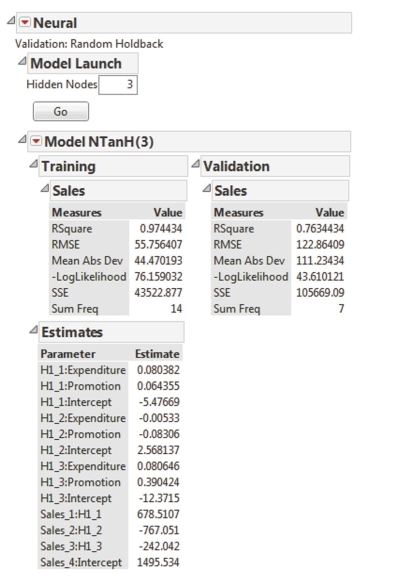 -Referring to Scenario 17-6, how many hidden nodes are used in the neural network model?
Free
(Short Answer)
5.0/5 (40)
Correct Answer:Verified
3
SCENARIO 17-2 The treemap below shows the amounts (size)measured in billions of US dollars and percentage changes from prior year (color)of business-to-consumer e-commerce sales last year for North America, Asia Pacific, Western Europe, Central & Eastern Europe, Latin America, and Middle East & Africa. 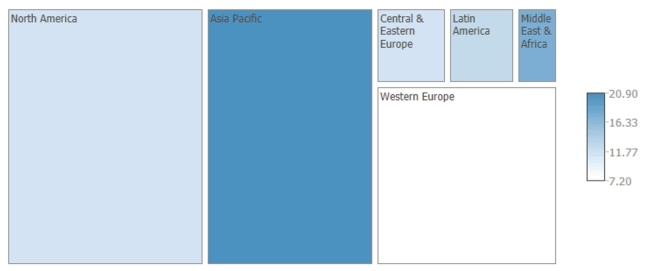 -Referring to Scenario 17-2, which region has the fastest growth in business-to-consumer e-commerce sales last year?
(Short Answer)
4.9/5 (29)
Which of the following explores business activities that have occurred or are occurring in the present moment?
(Multiple Choice)
4.8/5 (38)
In real-world business analytics, filtering is typically performed on large data based on complex conditional relationships.
(True/False)
4.8/5 (35)
Classification tree is not sensitive to the distribution of the independent variables.
(True/False)
4.9/5 (31)
SCENARIO 17-2 The treemap below shows the amounts (size)measured in billions of US dollars and percentage changes from prior year (color)of business-to-consumer e-commerce sales last year for North America, Asia Pacific, Western Europe, Central & Eastern Europe, Latin America, and Middle East & Africa.
-Referring to Scenario 17-2, the Western Europe region has the largest amount of business-to-consumer ecommerce sales last year.
(True/False)
4.9/5 (34)
The LogWorth statistic is used to decide when to split a node of a regression tree.
(True/False)
4.7/5 (44)
Average linkage can be used to measure the distance between clusters in cluster analysis.
(True/False)
4.9/5 (40)
The Akaike information criteria (AIC)or the corrected Akaike information criteria (AICc)is a measure of the probability that can be attributed to the response that has occurred.
(True/False)
4.8/5 (38)
Data mining uses various techniques to extract useful information from huge depositories of data.
(True/False)
4.8/5 (35)
Due to the amount of the space it consumes, some consider gauges little more than examples of chartjunk, even as many decision makers request them due to their visual appeal.
(True/False)
4.9/5 (41)
SCENARIO 17-1 The table below contains the sparklines for the rates of return (in percentage)for three different stocks from 2007 to 2013. 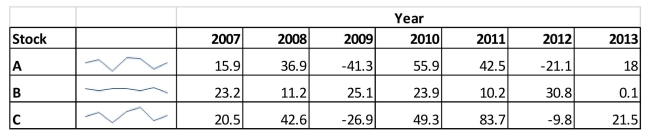 -Referring to Scenario 17-1, the sparklines enable you to draw conclusions on the historical trend of the rates of return of the three stocks.
(True/False)
4.9/5 (28)
In multidimensional scaling, the larger the stress statistic, the better is the fit.
(True/False)
4.8/5 (34)
Euclidean distance can be used to measure the distance between objects in cluster analysis.
(True/False)
4.9/5 (38)
Which of the following is NOT one of the categories of predictive analytics methods?
(Multiple Choice)
4.8/5 (40)
A classification tree uses rules and relationships to classify items into several groups
(True/False)
4.9/5 (29)
Filters
- Essay(0)
- Multiple Choice(0)
- Short Answer(0)
- True False(0)
- Matching(0)