Exam 10: Two-Sample Tests
Exam 1: Defining and Collecting Data207 Questions
Exam 2: Organizing and Visualizing Variables213 Questions
Exam 3: Numerical Descriptive Measures167 Questions
Exam 4: Basic Probability171 Questions
Exam 5: Discrete Probability Distributions217 Questions
Exam 6: The Normal Distributions and Other Continuous Distributions189 Questions
Exam 7: Sampling Distributions135 Questions
Exam 8: Confidence Interval Estimation189 Questions
Exam 9: Fundamentals of Hypothesis Testing: One-Sample Tests187 Questions
Exam 10: Two-Sample Tests208 Questions
Exam 11: Analysis of Variance216 Questions
Exam 12: Chi-Square and Nonparametric Tests178 Questions
Exam 13: Simple Linear Regression214 Questions
Exam 14: Introduction to Multiple Regression336 Questions
Exam 15: Multiple Regression Model Building99 Questions
Exam 16: Time-Series Forecasting173 Questions
Exam 17: Business Analytics115 Questions
Exam 18: A Roadmap for Analyzing Data329 Questions
Exam 19: Statistical Applications in Quality Management Online162 Questions
Exam 20: Decision Making Online129 Questions
Exam 21: Understanding Statistics: Descriptive and Inferential Techniques39 Questions
Select questions type
When testing  the observed value of the Z test statistic was found to be - 2.13.The p-value for this test is
Free
(Multiple Choice)
4.9/5  (33)
(33)
Correct Answer: Verified
D
A powerful women's group has claimed that men and women differ in attitudes about sexual discrimination.A group of 50 men (group 1)and 40 women (group 2)were asked if they thought sexual discrimination is a problem in the United States.Of those sampled, 11 of the men and 19 of the women did believe that sexual discrimination is a problem. Construct a 95% confidence interval estimate of the difference between the proportion of men and women who believe that sexual discrimination is a problem.
Free
(Short Answer)
4.9/5 (28)
Correct Answer:Verified
-0.448 to -0.062 or 0.062 to 0.448
When testing 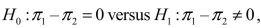 the observed value of the Z test statistic was found to be - 2.13.The p-value for this test is
Free
(Multiple Choice)
4.8/5 (34)
Correct Answer:Verified
B
SCENARIO 10-11 The dean of a college is interested in the proportion of graduates from his college who have a job offer on graduation day.He is particularly interested in seeing if there is a difference in this proportion for accounting and economics majors.In a random sample of 100 of each type of major at graduation, he found that 65 accounting majors and 52 economics majors had job offers. If the accounting majors are designated as "Group 1" and the economics majors are designated as "Group 2," perform the appropriate hypothesis test using a level of significance of 0.05.
-Referring to Scenario 10-11, construct a 95% confidence interval estimate of the difference in proportion between accounting majors and economic majors who have a job offer on graduation day.
(Short Answer)
4.9/5 (34)
A statistics professor wanted to test whether the grades on a statistics test were the same for upper and lower classmen.The professor took a random sample of size 10 from each, conducted a test and found out that the variances were equal.For this situation, the professor should use a t test with related samples.
(True/False)
4.9/5 (34)
SCENARIO 10-15 The table below presents the summary statistics for the starting annual salaries (in thousands of dollars)for individuals entering the public accounting and financial planning professions. 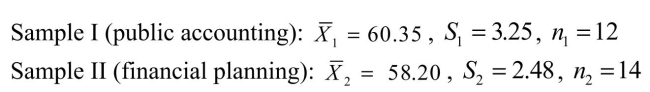 Test whether the mean starting annual salaries for individuals entering the public accounting professions is higher than that of financial planning assuming that the two population variances are the same.
-Referring to Scenario 10-15, what is the 95% confidence interval estimate for the difference in the two means?
Test whether the mean starting annual salaries for individuals entering the public accounting professions is higher than that of financial planning assuming that the two population variances are the same.
-Referring to Scenario 10-15, what is the 95% confidence interval estimate for the difference in the two means?
(Short Answer)
4.8/5 (44)
SCENARIO 10-13 The amount of time required to reach a customer service representative has a huge impact on customer satisfaction.Below is the Excel output from a study to see whether there is evidence of a difference in the mean amounts of time required to reach a customer service representative between two hotels.Assume that the population variances in the amount of time for the two hotels are not equal. 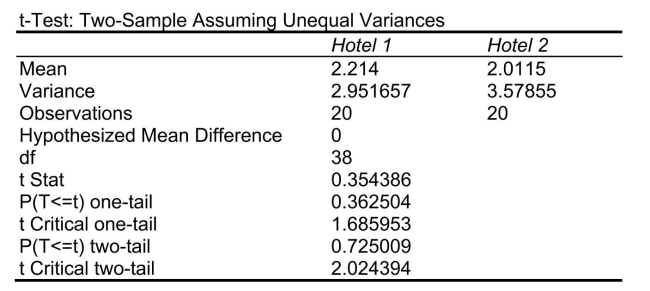 -Referring to Scenario 10-13, what is the critical value for testing if there is evidence of a difference in the variabilities of the amount of time required to reach a customer service representative between the two hotels at the 5% level of significance?
(Essay)
4.8/5 (32)
Moving companies are required by the government to publish a Carrier Performance Report each year.One of the descriptive statistics they must include is the annual percentage of shipments on which a $50 or greater claim for loss or damage was filed. Suppose two companies, Econo-Move and On-the-Move, each decide to estimate this figure by sampling their records, and they report the data shown in the following table.  The owner of On-the-Move is hoping to use these data to show that the company is superior to Econo-Move with regard to the percentage of claims filed.Which test would be used to properly analyze the data in this experiment?
(Multiple Choice)
4.8/5 (30)
SCENARIO 10-4 Two samples each of size 25 are taken from independent populations assumed to be normally distributed with equal variances.The first sample has a mean of 35.5 and standard deviation of 3.0 while the second sample has a mean of 33.0 and standard deviation of 4.0.
-Referring to Scenario 10-4, if you were interested in testing against the one-tail alternative that 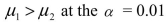 level of significance, the null hypothesis would ______ (be rejected/not be rejected).
(Short Answer)
4.9/5 (30)
SCENARIO 10-14 The use of preservatives by food processors has become a controversial issue.Suppose two preservatives are extensively tested and determined safe for use in meats.A processor wants to compare the preservatives for their effects on retarding spoilage.Suppose 15 cuts of fresh meat are treated with preservative I and 15 are treated with preservative II, and the number of hours until spoilage begins is recorded for each of the 30 cuts of meat.The results are summarized in the table below. 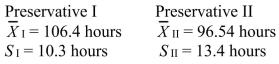 -Referring to Scenario 10-14, what assumptions are necessary for testing if the population variances differ for preservatives I and II?
(Multiple Choice)
4.9/5 (32)
SCENARIO 10-6 To investigate the efficacy of a diet, a random sample of 16 male patients is selected from a population of adult males using the diet.The weight of each individual in the sample is taken at the start of the diet and at a medical follow-up 4 weeks later.Assuming that the population of differences in weight before versus after the diet follow a normal distribution, the t-test for related samples can be used to determine if there was a significant decrease in the mean weight during this period.Suppose the mean decrease in weights over all 16 subjects in the study is 3.0 pounds with the standard deviation of differences computed as 6.0 pounds.
-Referring to Scenario 10-6, the computed t statistic is _______.
(Short Answer)
4.9/5 (35)
SCENARIO 10-8 A few years ago, Pepsi invited consumers to take the "Pepsi Challenge." Consumers were asked to decide which of two sodas, Coke or Pepsi, they preferred in a blind taste test.Pepsi was interested in determining what factors played a role in people's taste preferences.One of the factors studied was the gender of the consumer.Below are the results of analyses comparing the taste preferences of men and women with the proportions depicting preference for Pepsi. 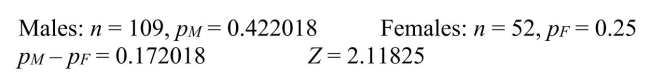 -Referring to Scenario 10-8, construct a 99% confidence interval estimate of the difference between the proportion of males and females who prefer Pepsi.
(Short Answer)
4.8/5 (34)
SCENARIO 10-14 The use of preservatives by food processors has become a controversial issue.Suppose two preservatives are extensively tested and determined safe for use in meats.A processor wants to compare the preservatives for their effects on retarding spoilage.Suppose 15 cuts of fresh meat are treated with preservative I and 15 are treated with preservative II, and the number of hours until spoilage begins is recorded for each of the 30 cuts of meat.The results are summarized in the table below.
-Referring to Scenario 10-14, suppose  = 0.05.Which of the following represents the correct conclusion?
(Multiple Choice)
4.8/5 (30)
SCENARIO 10-14 The use of preservatives by food processors has become a controversial issue.Suppose two preservatives are extensively tested and determined safe for use in meats.A processor wants to compare the preservatives for their effects on retarding spoilage.Suppose 15 cuts of fresh meat are treated with preservative I and 15 are treated with preservative II, and the number of hours until spoilage begins is recorded for each of the 30 cuts of meat.The results are summarized in the table below.
-Referring to Scenario 10-14, what is the value of the test statistic for testing if the population variances differ for preservatives I and II?
(Short Answer)
4.8/5 (36)
SCENARIO 10-10 A corporation randomly selects 150 salespeople and finds that 66% who have never taken a self- improvement course would like such a course.The firm did a similar study 10 years ago in which 60% of a random sample of 160 salespeople wanted a self-improvement course.The groups are assumed to be independent random samples.Let  and
and  represent the true proportion of workers who would like to attend a self-improvement course in the recent study and the past study, respectively.
-Referring to Scenario 10-10, the company tests to determine at the 0.05 level whether the population proportion has changed from the previous study.Which of the following is correct?
represent the true proportion of workers who would like to attend a self-improvement course in the recent study and the past study, respectively.
-Referring to Scenario 10-10, the company tests to determine at the 0.05 level whether the population proportion has changed from the previous study.Which of the following is correct?
(Multiple Choice)
4.8/5 (40)
SCENARIO 10-3 A real estate company is interested in testing whether the mean time that families in Gotham have been living in their current homes is less than families in Metropolis.Assume that the two population variances are equal.A random sample of 100 families from Gotham and a random sample of 150 families in Metropolis yield the following data on length of residence in current homes.  -Referring to Scenario 10-3, suppose
  = 0.10.Which of the following represents the correct conclusion?
(Multiple Choice)
4.9/5 (36)
SCENARIO 10-10 A corporation randomly selects 150 salespeople and finds that 66% who have never taken a self- improvement course would like such a course.The firm did a similar study 10 years ago in which 60% of a random sample of 160 salespeople wanted a self-improvement course.The groups are assumed to be independent random samples.Let and represent the true proportion of workers who would like to attend a self-improvement course in the recent study and the past study, respectively.
-Referring to Scenario 10-10, construct a 90% confidence interval estimate of the difference in proportion of workers who would like to attend a self-improvement course in the recent study and the past study.
(Short Answer)
4.8/5 (34)
SCENARIO 10-5 To test the effectiveness of a business school preparation course, 8 students took a general business test before and after the course.The results are given below.  -Referring to Scenario 10-5, what is the critical value for testing at the 5% level of significance whether the business school preparation course is effective in improving exam scores?
(Multiple Choice)
4.9/5 (35)
SCENARIO 10-6 To investigate the efficacy of a diet, a random sample of 16 male patients is selected from a population of adult males using the diet.The weight of each individual in the sample is taken at the start of the diet and at a medical follow-up 4 weeks later.Assuming that the population of differences in weight before versus after the diet follow a normal distribution, the t-test for related samples can be used to determine if there was a significant decrease in the mean weight during this period.Suppose the mean decrease in weights over all 16 subjects in the study is 3.0 pounds with the standard deviation of differences computed as 6.0 pounds.
-Referring to Scenario 10-6, what is the 95% confidence interval estimate for the mean difference in weight before and after the diet?
(Short Answer)
4.7/5 (34)
When you test for differences between the means of two independent populations, you can only use a two-tail test.
(True/False)
4.8/5 (35)
Filters
- Essay(0)
- Multiple Choice(0)
- Short Answer(0)
- True False(0)
- Matching(0)