Exam 3: Numerical Descriptive Measures
Exam 1: Defining and Collecting Data207 Questions
Exam 2: Organizing and Visualizing Variables213 Questions
Exam 3: Numerical Descriptive Measures167 Questions
Exam 4: Basic Probability171 Questions
Exam 5: Discrete Probability Distributions217 Questions
Exam 6: The Normal Distributions and Other Continuous Distributions189 Questions
Exam 7: Sampling Distributions135 Questions
Exam 8: Confidence Interval Estimation189 Questions
Exam 9: Fundamentals of Hypothesis Testing: One-Sample Tests187 Questions
Exam 10: Two-Sample Tests208 Questions
Exam 11: Analysis of Variance216 Questions
Exam 12: Chi-Square and Nonparametric Tests178 Questions
Exam 13: Simple Linear Regression214 Questions
Exam 14: Introduction to Multiple Regression336 Questions
Exam 15: Multiple Regression Model Building99 Questions
Exam 16: Time-Series Forecasting173 Questions
Exam 17: Business Analytics115 Questions
Exam 18: A Roadmap for Analyzing Data329 Questions
Exam 19: Statistical Applications in Quality Management Online162 Questions
Exam 20: Decision Making Online129 Questions
Exam 21: Understanding Statistics: Descriptive and Inferential Techniques39 Questions
Select questions type
According to the Chebyshev rule, at least what percentage of the observations in any data set are contained within 3 standard deviations around the mean?
Free
(Multiple Choice)
4.7/5  (43)
(43)
Correct Answer: Verified
C
SCENARIO 3-11 Given below are the closing prices for the Dow Jones Industrial Average (DJIA)and the Standard & Poor's (S&P)500 Index over 10-weeks sometime in the past.  -Referring to Scenario 3-11, how will you classify the linear relationship between the DJIA and the S&P 500 index?
Free
(Multiple Choice)
4.8/5 (36)
Correct Answer:Verified
C
The Z score of a value measures how many standard deviations the value is from the mean.
Free
(True/False)
4.9/5 (41)
Correct Answer:Verified
True
SCENARIO 3-4 The ordered array below represents the number of cargo manifests approved by customs inspectors of the Port of New York in a sample of 35 days:  Note: For this sample, the sum of the values is 838, and the sum of the squared differences between each value and the mean is 619.89.
-Referring to Scenario 3-4, the five-number summary for the data in the customs sample consists of ________, ________, ________, ________, ________.
Note: For this sample, the sum of the values is 838, and the sum of the squared differences between each value and the mean is 619.89.
-Referring to Scenario 3-4, the five-number summary for the data in the customs sample consists of ________, ________, ________, ________, ________.
(Short Answer)
4.8/5 (28)
SCENARIO 3-2 The data below represent the number of grams of carbohydrates in a serving of breakfast cereal in a sample of 11 different servings. 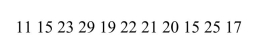 -Referring to Scenario 3-2, the median carbohydrate amount in the cereal is ________ grams.
(Short Answer)
5.0/5 (42)
SCENARIO 3-3 The ordered array below represents the number of vitamin supplements sold by a health food store in a sample of 16 days.  Note: For this sample, the sum of the values is 448, and the sum of the squared differences between each value and the mean is 812.
-Referring to Scenario 3-3, the standard deviation of the number of vitamin supplements sold in this sample is ________.
Note: For this sample, the sum of the values is 448, and the sum of the squared differences between each value and the mean is 812.
-Referring to Scenario 3-3, the standard deviation of the number of vitamin supplements sold in this sample is ________.
(Short Answer)
4.8/5 (32)
According to the empirical rule, if the data form a "bell-shaped" normal distribution, _______ percent of the observations will be contained within 1 standard deviation around the arithmetic mean.
(Multiple Choice)
4.7/5 (32)
The interquartile range is a measure of central tendency in a set of data.
(True/False)
4.8/5 (33)
The geometric mean is a measure of variation or dispersion in a set of data.
(True/False)
4.9/5 (38)
According to the Chebyshev rule, at least 75% of all observations in any data set are contained within how many standard deviations around the mean?
(Multiple Choice)
4.8/5 (31)
SCENARIO 3-12 Given below are the rating and performance scores of 15 laptop computers. 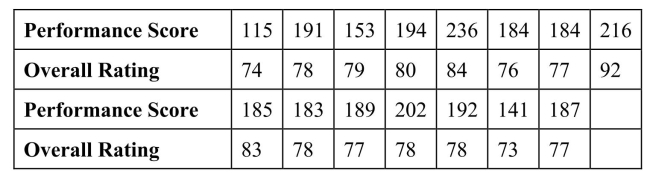 -Referring to Scenario 3-12, for a laptop computer that has a high rating, you will expect its performance score to
(Multiple Choice)
4.8/5 (32)
SCENARIO 3-10 The population of eight analysts at a software firm were asked to estimate the reuse rate when developing a new software system.The following data are given as a percentage of the total code written for a software system that is part of the reuse database. 50, 62.5, 37.5, 75.0, 45.0, 47.5, 15.0, 25.0
-Referring to Scenario 3-10, what are the variance and standard deviation of the total code that is part of the reuse database?
(Short Answer)
4.9/5 (52)
In left-skewed distributions, which of the following is the correct statement?
(Multiple Choice)
4.8/5 (35)
SCENARIO 3-1 Health care issues are receiving much attention in both academic and political arenas.A sociologist recently conducted a survey of citizens over 60 years of age whose net worth is too high to qualify for Medicaid.The ages of 25 senior citizens were as follows:  -Referring to Scenario 3-1, identify which of the following is the correct statement.
(Multiple Choice)
4.8/5 (35)
SCENARIO 3-3 The ordered array below represents the number of vitamin supplements sold by a health food store in a sample of 16 days. Note: For this sample, the sum of the values is 448, and the sum of the squared differences between each value and the mean is 812.
-Referring to Scenario 3-3, the third quartile of the number of vitamin supplements sold in this sample is ________.
(Short Answer)
4.8/5 (29)
In general, which of the following descriptive summary measures cannot be easily approximated from a boxplot?
(Multiple Choice)
4.8/5 (38)
SCENARIO 3-3 The ordered array below represents the number of vitamin supplements sold by a health food store in a sample of 16 days. Note: For this sample, the sum of the values is 448, and the sum of the squared differences between each value and the mean is 812.
-Referring to Scenario 3-3, the median number of vitamin supplements sold in this sample is ________.
(Short Answer)
4.8/5 (31)
According to the empirical rule, if the data form a "bell-shaped" normal distribution, _______ percent of the observations will be contained within 2 standard deviations around the arithmetic mean.
(Multiple Choice)
4.7/5 (45)
According to the empirical rule, if the data form a "bell-shaped" normal distribution, _______ percent of the observations will be contained within 3 standard deviations around the arithmetic mean.
(Multiple Choice)
4.9/5 (26)
Filters
- Essay(0)
- Multiple Choice(0)
- Short Answer(0)
- True False(0)
- Matching(0)