Exam 31: Understanding Direct and Inverse Relationships between Variables
Exam 1: Introducing the Economic Way of Thinking85 Questions
Exam 2: Production Possibilities Opportunity Cost and Economic Growth107 Questions
Exam 3: Market Demand and Supply176 Questions
Exam 4: Markets in Action137 Questions
Exam 5: Price Elasticity of Demand and Supply151 Questions
Exam 6: Consumer Choice Theory96 Questions
Exam 7: Production Costs131 Questions
Exam 8: Perfect Competition126 Questions
Exam 9: Monopoly81 Questions
Exam 10: Monopolistic Competition and Oligopoly97 Questions
Exam 11: Labor Markets105 Questions
Exam 12: Income Distribution Poverty and Discrimination57 Questions
Exam 13: Antitrust and Regulation96 Questions
Exam 14: Environmental Economics47 Questions
Exam 15: Gross Domestic Product109 Questions
Exam 16: Business Cycles and Unemployment94 Questions
Exam 17: Inflation56 Questions
Exam 18: The Keynesian Model111 Questions
Exam 19: The Keynesian Model in Action105 Questions
Exam 20: Aggregate Demand and Supply94 Questions
Exam 21: Fiscal Policy108 Questions
Exam 22: The Public Sector55 Questions
Exam 23: Federal Deficits Surpluses and the National Debt42 Questions
Exam 24: Money and the Federal Reserve System75 Questions
Exam 25: Money Creation117 Questions
Exam 26: Monetary Policy106 Questions
Exam 27: The Phillips Curve and Expectations Theory59 Questions
Exam 28: International Trade and Finance127 Questions
Exam 29: Economies in Transition46 Questions
Exam 30: Growth and the Less Developed Countries55 Questions
Exam 31: Understanding Direct and Inverse Relationships between Variables172 Questions
Select questions type
If the slope of the indifference curve for goods X and Y is -2, then the marginal rate of substitution is
(Multiple Choice)
4.9/5  (36)
(36)
The equation for a budget line for goods X and Y, with Px being the price of X, Py being the price of Y, and B being the budget, can be written as:
(Multiple Choice)
4.9/5 (33)
Exhibit 10A-1 Aggregate demand and supply model
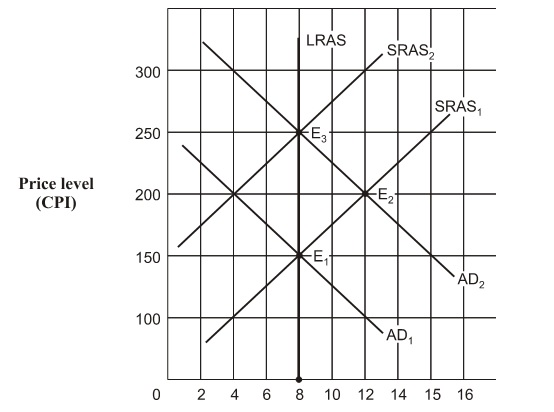 Based on Exhibit 10A-1, when the aggregate demand curve shifts to the position AD2 and the economy is operating at point E2, the economy's position of long-run equilibrium corresponds to point:
(Multiple Choice)
4.8/5 (47)
Exhibit 6A-6 Consumer equilibrium
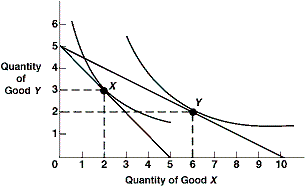 As shown in Exhibit 6A-6, movement from consumer equilibrium at point Y to point X is caused by a(n):
(Multiple Choice)
4.7/5 (43)
If Max's marginal rate of substitution for goods A and B is 3, then
(Multiple Choice)
4.9/5 (44)
Consumer equilibrium occurs where the budget line is tangent to the:
(Multiple Choice)
4.8/5 (41)
Assuming peaches are a normal good and consumer incomes rise, producer surplus in the peach market:
(Multiple Choice)
4.7/5 (42)
If Sam is willing to pay $50 for one unit of good X, $30 for a second, $20 for a third, $8 for a fourth, and the market price is $10, then Sam's consumer surplus is:
(Multiple Choice)
4.8/5 (36)
Exhibit 3A-1 Comparison of Market Efficiency and Deadweight Loss
 As shown in Exhibit 3A-1, if the quantity supplied is 2 million pounds of ground beef per year, the result is a deadweight loss represented by area:
(Multiple Choice)
4.8/5 (38)
Consumer surplus measures the value between the price consumers are willing to pay and the:
(Multiple Choice)
4.8/5 (40)
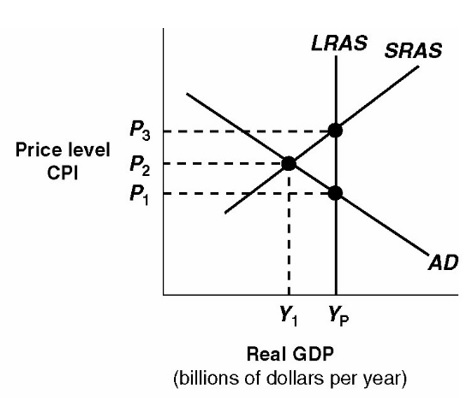 Macro AD-AS Model
In Exhibit 10A-4, the level of real GDP represented by Y p :
Macro AD-AS Model
In Exhibit 10A-4, the level of real GDP represented by Y p :
(Multiple Choice)
4.9/5 (46)
Exhibit 1A-8 Straight line relationship
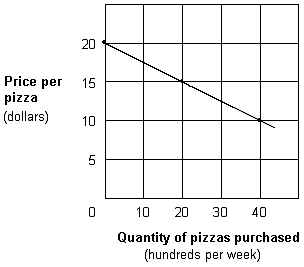 Which of the following would cause a shift in the relationship shown in Exhibit 1A-8?
(Multiple Choice)
4.7/5 (39)
Exhibit 6A-6 Consumer equilibrium
 Given the budget lines and indifference curves shown in Exhibit 6A-6, if the budget line shifts, then the equilibrium points X and Y:
(Multiple Choice)
4.7/5 (39)
If the amount of time spent procrastinating and the performance on an exam are inversely related, then
(Multiple Choice)
4.8/5 (37)
Assume the economy is in short-run equilibrium at a real GDP above its potential real GDP. According to classical theory, which of the following policies should be followed?
(Multiple Choice)
4.9/5 (36)
Exhibit 3A-1 Comparison of Market Efficiency and Deadweight Loss
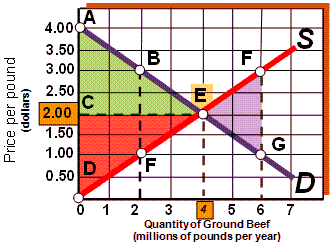 As shown in Exhibit 3A-1, if the market is in equilibrium, then ____ represents total surplus.
(Multiple Choice)
4.8/5 (34)
One reason for the short-run aggregate supply curve (SRAS) is:
(Multiple Choice)
5.0/5 (36)
Suppose two variables are directly related. If one variable rises, then the other variable:
(Multiple Choice)
4.7/5 (41)
Filters
- Essay(0)
- Multiple Choice(0)
- Short Answer(0)
- True False(0)
- Matching(0)