Exam 31: Understanding Direct and Inverse Relationships between Variables
Exam 1: Introducing the Economic Way of Thinking85 Questions
Exam 2: Production Possibilities Opportunity Cost and Economic Growth107 Questions
Exam 3: Market Demand and Supply176 Questions
Exam 4: Markets in Action137 Questions
Exam 5: Price Elasticity of Demand and Supply151 Questions
Exam 6: Consumer Choice Theory96 Questions
Exam 7: Production Costs131 Questions
Exam 8: Perfect Competition126 Questions
Exam 9: Monopoly81 Questions
Exam 10: Monopolistic Competition and Oligopoly97 Questions
Exam 11: Labor Markets105 Questions
Exam 12: Income Distribution Poverty and Discrimination57 Questions
Exam 13: Antitrust and Regulation96 Questions
Exam 14: Environmental Economics47 Questions
Exam 15: Gross Domestic Product109 Questions
Exam 16: Business Cycles and Unemployment94 Questions
Exam 17: Inflation56 Questions
Exam 18: The Keynesian Model111 Questions
Exam 19: The Keynesian Model in Action105 Questions
Exam 20: Aggregate Demand and Supply94 Questions
Exam 21: Fiscal Policy108 Questions
Exam 22: The Public Sector55 Questions
Exam 23: Federal Deficits Surpluses and the National Debt42 Questions
Exam 24: Money and the Federal Reserve System75 Questions
Exam 25: Money Creation117 Questions
Exam 26: Monetary Policy106 Questions
Exam 27: The Phillips Curve and Expectations Theory59 Questions
Exam 28: International Trade and Finance127 Questions
Exam 29: Economies in Transition46 Questions
Exam 30: Growth and the Less Developed Countries55 Questions
Exam 31: Understanding Direct and Inverse Relationships between Variables172 Questions
Select questions type
Exhibit 1A-10 Multi-curve graph
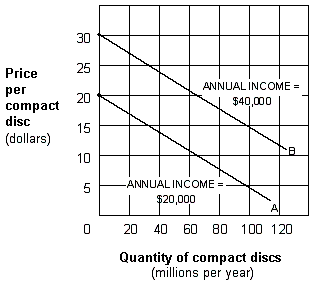 Exhibit 1A-10 represents a three-variable relationship. As the annual income of consumers rises from $20,000 (line A) to $40,000 (line B), the result is a:
(Multiple Choice)
4.9/5  (37)
(37)
Beginning from full-employment macro equilibrium, increase in government spending will cause real GDP to:
(Multiple Choice)
4.8/5 (29)
Assume the economy is experiencing an inflationary gap, classical economists believe that:
(Multiple Choice)
4.8/5 (32)
Exhibit 6A-5 Consumer Equilibrium
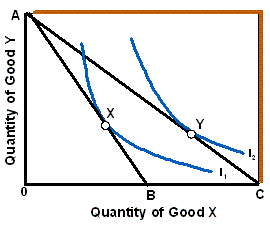 Given the budget lines and indifference curves shown in Exhibit 6A-5, if the budget line shifts from AB to AC, then the:
(Multiple Choice)
4.8/5 (41)
Exhibit 6A-2 Consumer Equilibrium
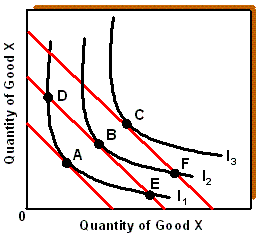 Given the budget lines and indifference curves shown in Exhibit 6A-2, point D yields:
(Multiple Choice)
4.7/5 (30)
Exhibit 10A-1 Aggregate demand and supply model
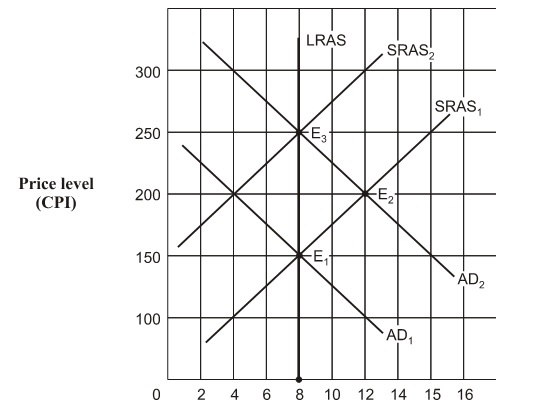 Beginning in Exhibit 10A-1 from long-run equilibrium at point E1, the aggregate demand curve shifts to AD2 . The economy's path to a new long-run equilibrium is represented by a movement from:
(Multiple Choice)
4.9/5 (35)
Exhibit 3A-2 Comparison of Market Efficiency and Deadweight Loss
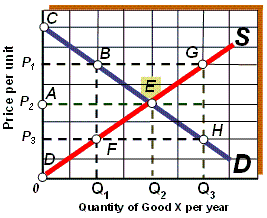 As shown in Exhibit 3A-2, if the market price falls from P2 to P3, then:
(Multiple Choice)
4.8/5 (32)
Suppose Sam buys a good for $100 at a yard sale. If consumer surplus from the sale is $75, Sam would have been willing to pay:
(Multiple Choice)
5.0/5 (36)
Exhibit 1A-7 Straight line relationship
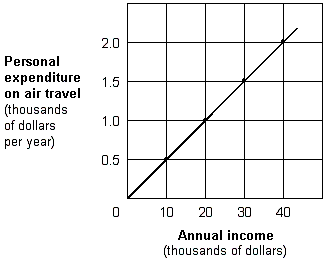 According to Exhibit 1A-7, the relationship between annual income and air-travel expenditures is:
(Multiple Choice)
4.9/5 (29)
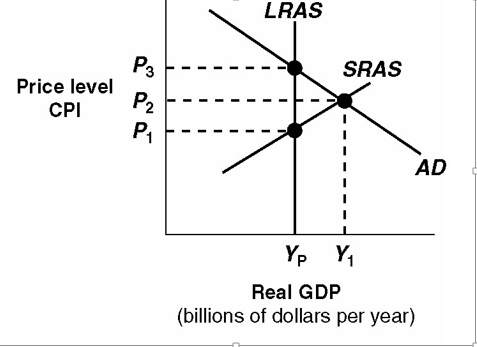
Exhibit 16A-2 Macro AD/AS Models
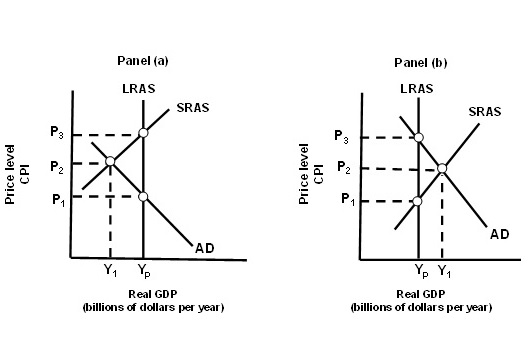 As shown in Panel (b) of Exhibit 16A-2, assume the economy adopts a classical nonintervention policy. Which of the following would cause the economy to self-correct?
(Multiple Choice)
4.8/5 (36)
Which of the following explains why higher prices in the goods and services market measured by the CPI leads to an upward-sloping aggregate supply curve?
(Multiple Choice)
4.8/5 (38)
Exhibit 1A-1 Straight line
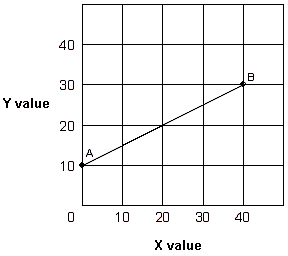 As shown in Exhibit 1A-1, the slope of straight line AB:
(Multiple Choice)
4.8/5 (35)
Which of the following is not true concerning the indifference map?
(Multiple Choice)
4.8/5 (47)
Exhibit 3A-1 Comparison of Market Efficiency and Deadweight Loss
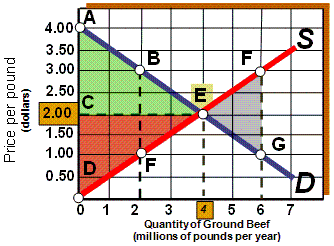 As shown in Exhibit 3A-1, if the market is in equilibrium, then producer surplus is represented by:
(Multiple Choice)
4.9/5 (40)
Exhibit 1A-5 Straight line
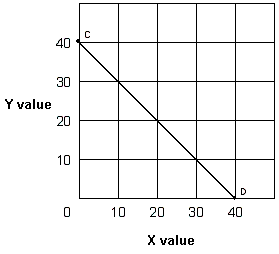 In Exhibit 1A-5, the slope for straight line CD is:
(Multiple Choice)
4.8/5 (50)
The net loss of consumer and producer surplus from underproduction or overproduction is called:
(Multiple Choice)
4.8/5 (37)
If the quantity of Good Y is measured on the vertical axis, the quantity of Good X is measured on horizontal axis, the price of Good X is $50, the price of Good Y is $20, and the budget is $500, the vertical intercept of the budget line is
(Multiple Choice)
4.7/5 (45)
Exhibit 16A-2 Macro AD/AS Models
 In Panel (b) of Exhibit 16A-2, a Keynesian expansionary stabilization policy designed to move the economy from Y1 to Yp would attempt to shift the
(Multiple Choice)
4.8/5 (36)
Exhibit 10A-3 Macro AD-AS Model
 In Exhibit 10A-3, the level of real GDP represented by Yp:
(Multiple Choice)
4.8/5 (45)
Filters
- Essay(0)
- Multiple Choice(0)
- Short Answer(0)
- True False(0)
- Matching(0)