Exam 31: Understanding Direct and Inverse Relationships between Variables
Exam 1: Introducing the Economic Way of Thinking85 Questions
Exam 2: Production Possibilities Opportunity Cost and Economic Growth107 Questions
Exam 3: Market Demand and Supply176 Questions
Exam 4: Markets in Action137 Questions
Exam 5: Price Elasticity of Demand and Supply151 Questions
Exam 6: Consumer Choice Theory96 Questions
Exam 7: Production Costs131 Questions
Exam 8: Perfect Competition126 Questions
Exam 9: Monopoly81 Questions
Exam 10: Monopolistic Competition and Oligopoly97 Questions
Exam 11: Labor Markets105 Questions
Exam 12: Income Distribution Poverty and Discrimination57 Questions
Exam 13: Antitrust and Regulation96 Questions
Exam 14: Environmental Economics47 Questions
Exam 15: Gross Domestic Product109 Questions
Exam 16: Business Cycles and Unemployment94 Questions
Exam 17: Inflation56 Questions
Exam 18: The Keynesian Model111 Questions
Exam 19: The Keynesian Model in Action105 Questions
Exam 20: Aggregate Demand and Supply94 Questions
Exam 21: Fiscal Policy108 Questions
Exam 22: The Public Sector55 Questions
Exam 23: Federal Deficits Surpluses and the National Debt42 Questions
Exam 24: Money and the Federal Reserve System75 Questions
Exam 25: Money Creation117 Questions
Exam 26: Monetary Policy106 Questions
Exam 27: The Phillips Curve and Expectations Theory59 Questions
Exam 28: International Trade and Finance127 Questions
Exam 29: Economies in Transition46 Questions
Exam 30: Growth and the Less Developed Countries55 Questions
Exam 31: Understanding Direct and Inverse Relationships between Variables172 Questions
Select questions type
Exhibit 6A-6 Consumer equilibrium
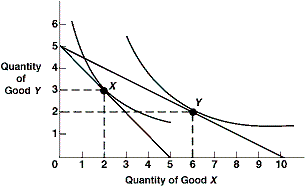 As shown in Exhibit 6A-6, the marginal rate of substitution (MRS) at point X is ____ the marginal rate of substitution at point Y.
(Multiple Choice)
5.0/5  (33)
(33)
The absolute value of the slope of an indifference curve is called the:
(Multiple Choice)
4.8/5 (36)
Exhibit 1A-5 Straight line
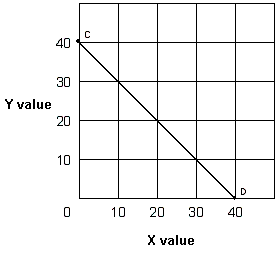 In Exhibit 1A-5, as X increases along the horizontal axis, from point C to point D on the line, the Y values
(Multiple Choice)
4.7/5 (47)
Exhibit 3A-1 Comparison of Market Efficiency and Deadweight Loss
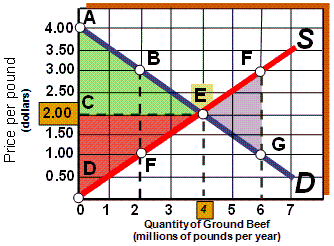 As shown in Exhibit 3A-1, if the market is in equilibrium, then total surplus is represented by:
(Multiple Choice)
4.8/5 (34)
Exhibit 10A-2 Macro AD-AS Model
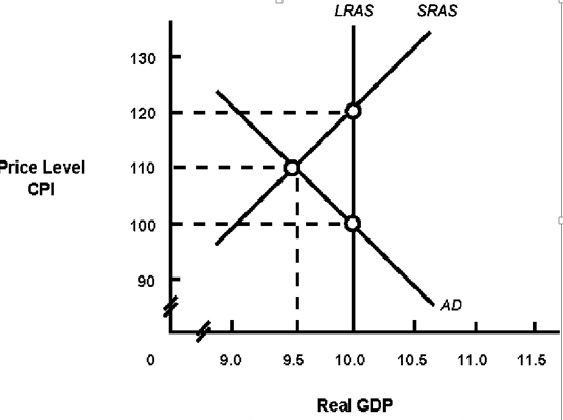 In Exhibit 10A-2, the long-run aggregate supply curve represents:
(Multiple Choice)
4.8/5 (37)
Exhibit 16A-3 Macro AD/AS Model
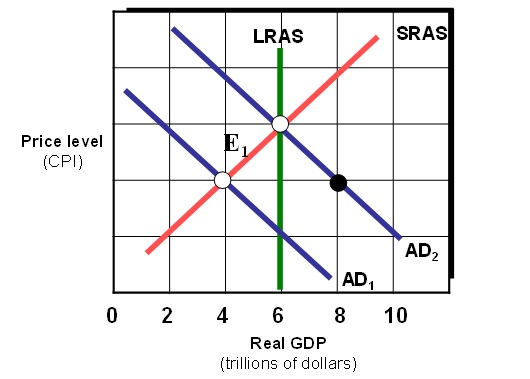 As shown in Exhibit 16A-3, assume the marginal propensity to consume MPC equals 0.80. Using discretionary fiscal policy, federal government spending should be _________ in order to restore the economy from E 1 to full employment.
(Multiple Choice)
4.8/5 (40)
If the amount of lemonade purchased and the outdoor temperature are directly related, then
(Multiple Choice)
4.9/5 (36)
Exhibit 1A-8 Straight line relationship
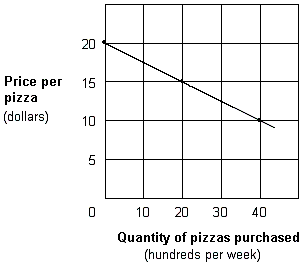 According to the Exhibit 1A-8, the relationship between the price and quantity purchased of pizza is:
(Multiple Choice)
4.9/5 (35)
The position of the long-run aggregate supply curve corresponds to the economy's:
(Multiple Choice)
4.8/5 (36)
Exhibit 1A-9 Multi-curve graph
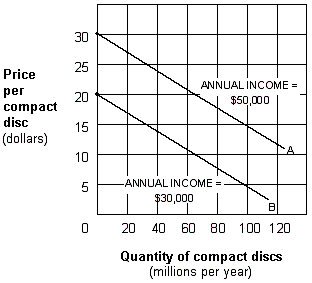 Exhibit 1A-9 represents a three-variable relationship. As the annual income of consumers falls from $50,000 (line A) to $30,000 (line B), the result is a:
(Multiple Choice)
4.9/5 (35)
Exhibit 6A-1 Budget line
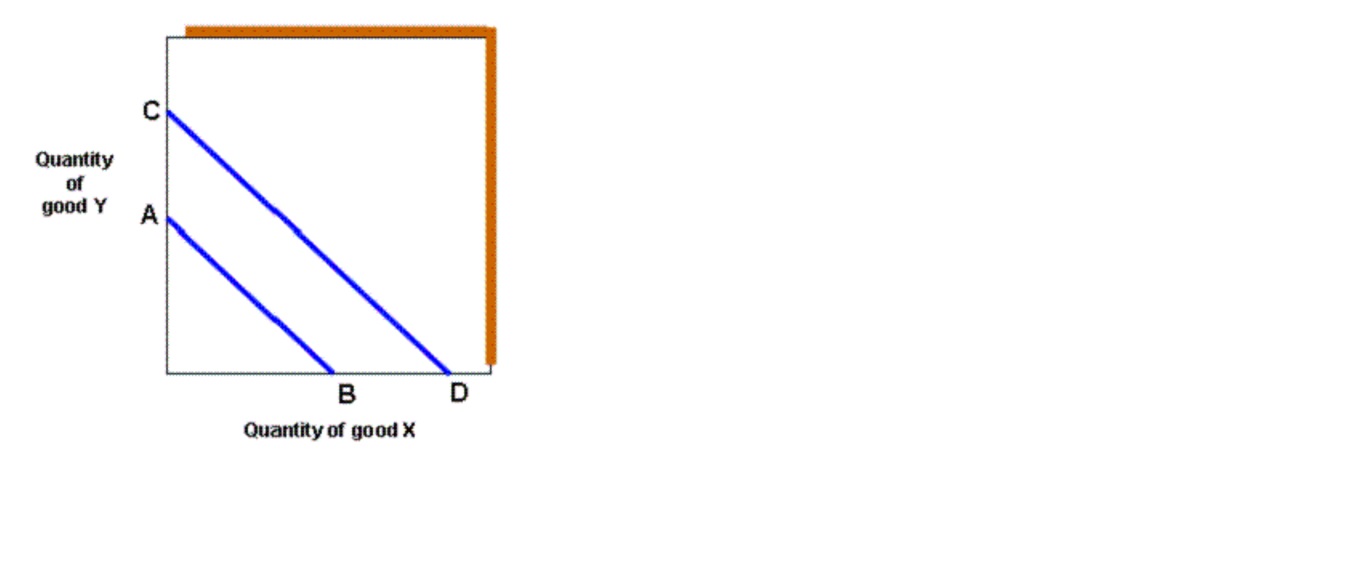 As shown in Exhibit 6A-1, a leftward shift in the budget line from CD to AB would result from:
(Multiple Choice)
4.7/5 (31)
The short-run aggregate supply curve (SRAS) is the amount of real GDP:
(Multiple Choice)
4.8/5 (37)
Which of the following pairs is the most likely to exhibit a direct relationship?
(Multiple Choice)
4.7/5 (42)
When an inverse relationship is graphed, the resulting line or curve is:
(Multiple Choice)
4.8/5 (37)
Exhibit 10A-6 Aggregate demand and supply model
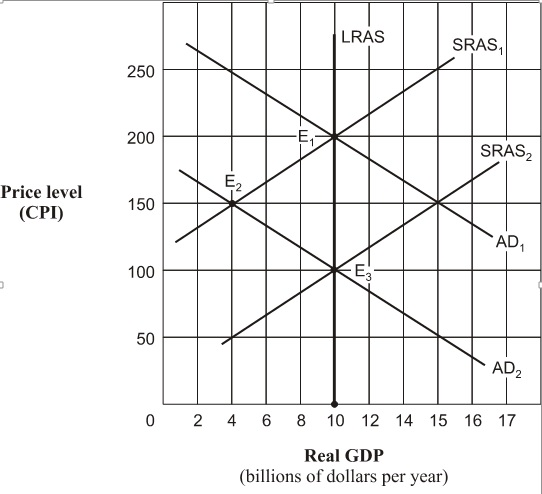 Beginning from a point of short-run equilibrium at point E2 in Exhibit 10A-6, the economy's movement to a new position of long-run equilibrium from that point would best be described as:
(Multiple Choice)
4.7/5 (45)
Exhibit 1A-2 Straight line
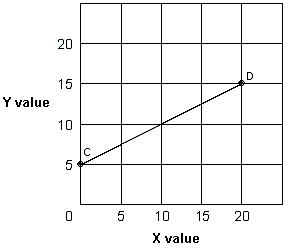 In Exhibit 1A-2, explain the slope of straight line CD.
(Multiple Choice)
4.9/5 (41)
Exhibit 1A-7 Straight line relationship
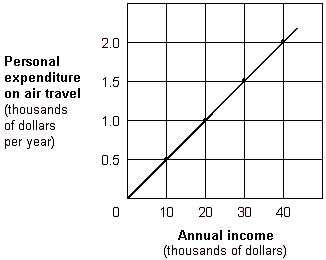 Which of the following would cause a shift in the relationship shown in Exhibit 1A-7?
(Multiple Choice)
4.8/5 (39)
Filters
- Essay(0)
- Multiple Choice(0)
- Short Answer(0)
- True False(0)
- Matching(0)