Exam 31: Understanding Direct and Inverse Relationships between Variables
Exam 1: Introducing the Economic Way of Thinking85 Questions
Exam 2: Production Possibilities Opportunity Cost and Economic Growth107 Questions
Exam 3: Market Demand and Supply176 Questions
Exam 4: Markets in Action137 Questions
Exam 5: Price Elasticity of Demand and Supply151 Questions
Exam 6: Consumer Choice Theory96 Questions
Exam 7: Production Costs131 Questions
Exam 8: Perfect Competition126 Questions
Exam 9: Monopoly81 Questions
Exam 10: Monopolistic Competition and Oligopoly97 Questions
Exam 11: Labor Markets105 Questions
Exam 12: Income Distribution Poverty and Discrimination57 Questions
Exam 13: Antitrust and Regulation96 Questions
Exam 14: Environmental Economics47 Questions
Exam 15: Gross Domestic Product109 Questions
Exam 16: Business Cycles and Unemployment94 Questions
Exam 17: Inflation56 Questions
Exam 18: The Keynesian Model111 Questions
Exam 19: The Keynesian Model in Action105 Questions
Exam 20: Aggregate Demand and Supply94 Questions
Exam 21: Fiscal Policy108 Questions
Exam 22: The Public Sector55 Questions
Exam 23: Federal Deficits Surpluses and the National Debt42 Questions
Exam 24: Money and the Federal Reserve System75 Questions
Exam 25: Money Creation117 Questions
Exam 26: Monetary Policy106 Questions
Exam 27: The Phillips Curve and Expectations Theory59 Questions
Exam 28: International Trade and Finance127 Questions
Exam 29: Economies in Transition46 Questions
Exam 30: Growth and the Less Developed Countries55 Questions
Exam 31: Understanding Direct and Inverse Relationships between Variables172 Questions
Select questions type
Exhibit 16A-2 Macro AD/AS Models
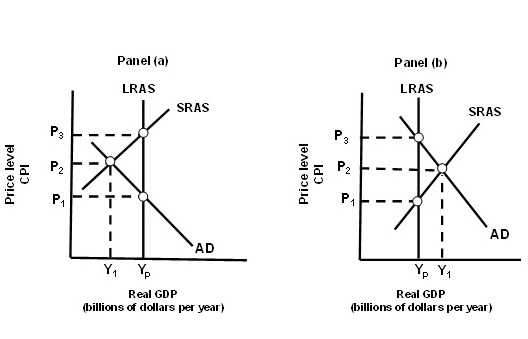 In Panel (b) of Exhibit 16A-2, the economy is initially in short-run equilibrium at real GDP level Y1 and price level P2. If the federal government or Fed decides to intervene, it would most likely:
(Multiple Choice)
4.9/5  (34)
(34)
In the long run, a decrease in aggregate demand causes the price level to _______ and the long-run aggregate supply curve to _____________.
(Multiple Choice)
4.8/5 (29)
Exhibit 1A-1 Straight line
 In Exhibit 1A-1, as X increases along the horizontal axis, from point A to point B on the line, the Y values
(Multiple Choice)
4.9/5 (37)
Exhibit 6A-5 Consumer Equilibrium
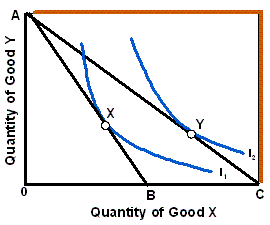 Given the budget lines and indifference curves shown in Exhibit 6A-5, if the budget line shifts from AB to AC, then the equilibrium points X and Y:
(Multiple Choice)
4.7/5 (39)
Assuming the economy is experiencing a recessionary gap, classical economists predict that:
(Multiple Choice)
4.9/5 (35)
Exhibit 10A-1 Aggregate demand and supply model
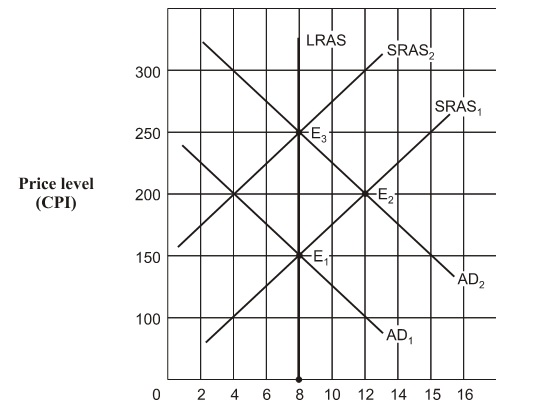 Beginning from short-run equilibrium at point E2 in Exhibit 10A-1, the economy's movement to a new position of long-run equilibrium would best be described as:
(Multiple Choice)
4.7/5 (42)
Which of the following pairs is the most likely to exhibit an inverse relationship?
(Multiple Choice)
4.8/5 (37)
Suppose Alice sells a good for $60 on eBay. If the producer surplus from the sale is $25, Alice's cost of the good must have been:
(Multiple Choice)
4.9/5 (39)
Exhibit 1A-3 Straight line
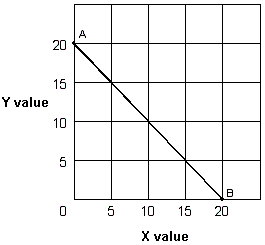 Straight line AB in Exhibit 1A-3 is a downward sloping line illustrating:
(Multiple Choice)
4.8/5 (47)
Exhibit 10A-5 Macro AD-AS Model
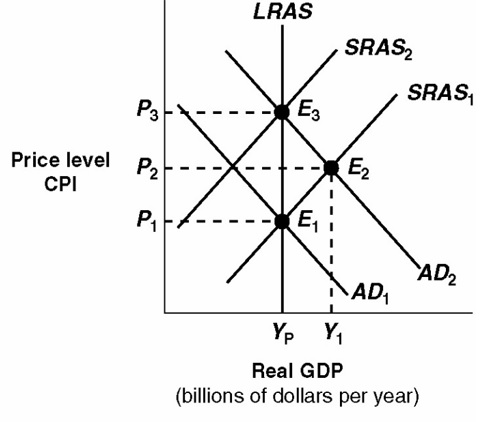
Economic growth is represented in Exhibit 10A-5 by:
Economic growth is represented in Exhibit 10A-5 by:
(Multiple Choice)
4.8/5 (40)
Which of the following is not a result if the quantity supplied exceeds the quantity demanded in a market?
(Multiple Choice)
4.8/5 (33)
Using supply and demand curve analysis, the triangular area above the equilibrium price and under the demand curve is:
(Multiple Choice)
4.8/5 (32)
Exhibit 6A-5 Consumer Equilibrium
 Given the budget lines and indifference curves shown in Exhibit 6A-5, if the budget line shifts from AC to AB, then the consumer will purchase:
(Multiple Choice)
4.8/5 (45)
Exhibit 3A-2 Comparison of Market Efficiency and Deadweight Loss
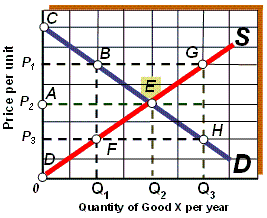 As shown in Exhibit 3A-2, if the market is in equilibrium, then total surplus is represented by:
(Multiple Choice)
4.8/5 (35)
Assume the price of good Y with its quantity measured on the vertical axis is $20 and the price of good X with its quantity measured on the horizontal axis is $5. If the consumer's budget is $100, then the absolute value of the slope of the budget line is:
(Multiple Choice)
5.0/5 (33)
Exhibit 1A-1 Straight line
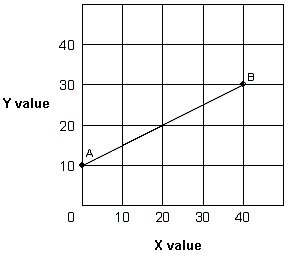 In Exhibit 1A-1, the slope of straight line AB is:
(Multiple Choice)
4.8/5 (36)
Graphically express a direct and an inverse or negative relationship. What could cause a shift in a line or curve expressing a relationship between two variables?
(Essay)
4.8/5 (29)
Filters
- Essay(0)
- Multiple Choice(0)
- Short Answer(0)
- True False(0)
- Matching(0)