Exam 31: Understanding Direct and Inverse Relationships between Variables
Exam 1: Introducing the Economic Way of Thinking85 Questions
Exam 2: Production Possibilities Opportunity Cost and Economic Growth107 Questions
Exam 3: Market Demand and Supply176 Questions
Exam 4: Markets in Action137 Questions
Exam 5: Price Elasticity of Demand and Supply151 Questions
Exam 6: Consumer Choice Theory96 Questions
Exam 7: Production Costs131 Questions
Exam 8: Perfect Competition126 Questions
Exam 9: Monopoly81 Questions
Exam 10: Monopolistic Competition and Oligopoly97 Questions
Exam 11: Labor Markets105 Questions
Exam 12: Income Distribution Poverty and Discrimination57 Questions
Exam 13: Antitrust and Regulation96 Questions
Exam 14: Environmental Economics47 Questions
Exam 15: Gross Domestic Product109 Questions
Exam 16: Business Cycles and Unemployment94 Questions
Exam 17: Inflation56 Questions
Exam 18: The Keynesian Model111 Questions
Exam 19: The Keynesian Model in Action105 Questions
Exam 20: Aggregate Demand and Supply94 Questions
Exam 21: Fiscal Policy108 Questions
Exam 22: The Public Sector55 Questions
Exam 23: Federal Deficits Surpluses and the National Debt42 Questions
Exam 24: Money and the Federal Reserve System75 Questions
Exam 25: Money Creation117 Questions
Exam 26: Monetary Policy106 Questions
Exam 27: The Phillips Curve and Expectations Theory59 Questions
Exam 28: International Trade and Finance127 Questions
Exam 29: Economies in Transition46 Questions
Exam 30: Growth and the Less Developed Countries55 Questions
Exam 31: Understanding Direct and Inverse Relationships between Variables172 Questions
Select questions type
Which of the following would cause a decrease (leftward shift) in the short-run aggregate supply curve (SRAS)?
(Multiple Choice)
4.9/5  (45)
(45)
Exhibit 6A-3 Consumer equilibrium
 Given the budget line and indifference curves shown in Exhibit 6A-3, point V is:
(Multiple Choice)
4.9/5 (38)
Exhibit 10A-2 Macro AD-AS Model
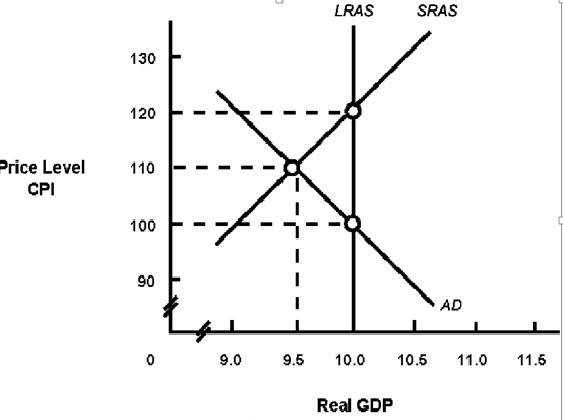 I n Exhibit 10A- 2, the intersection of AD with SRAS indicates:
(Multiple Choice)
4.8/5 (38)
Exhibit 3A-1 Comparison of Market Efficiency and Deadweight Loss
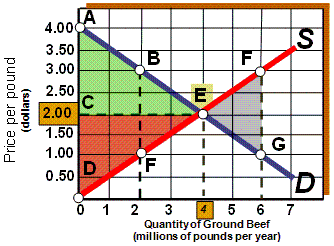 As shown in Exhibit 3A-1, if the market price falls from $2.00 to $1.00, then:
(Multiple Choice)
4.9/5 (30)
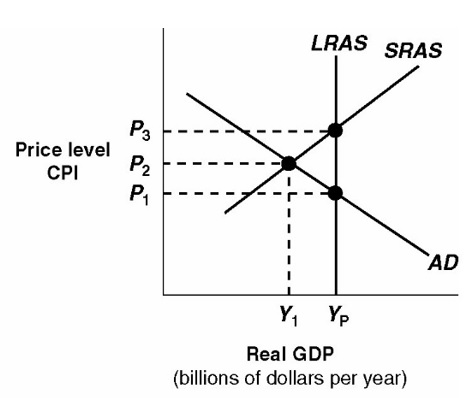
Exhibit 10A-1 Aggregate demand and supply model
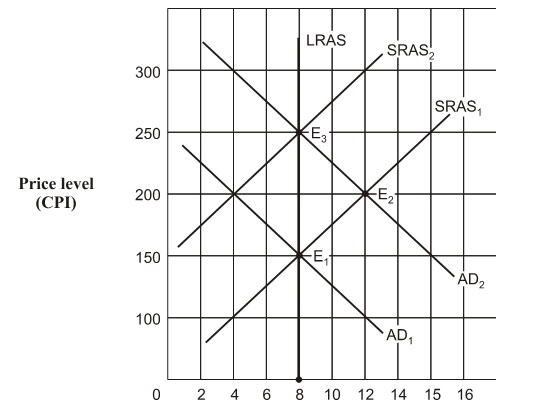 As shown in Exhibit 10A-1 and assuming the aggregate demand curve shifts from AD 1 and AD 2 , the full-employment level of real GDP is:
(Multiple Choice)
4.9/5 (34)
Which of the following causes a leftward shift in the short-run aggregate supply curve?
(Multiple Choice)
4.7/5 (44)
Exhibit 1A-8 Straight line relationship
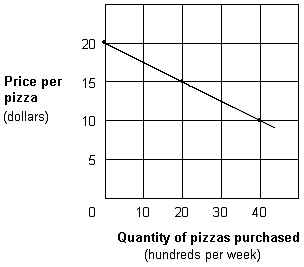 For the relationship shown in Exhibit 1A-8, suppose the price of hamburgers increases and hamburgers are a substitute for pizza. What change would occur on the graph?
(Multiple Choice)
4.9/5 (41)
Exhibit 6A-3 Consumer equilibrium
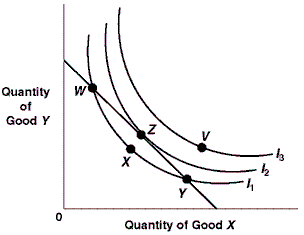 Given the budget line and indifference curves shown in Exhibit 6A-3, at point Z:
(Multiple Choice)
4.9/5 (37)
 Macro AD-AS Model
In Exhibit 10A-4, the self-correction argument is that in the long run, competition:
Macro AD-AS Model
In Exhibit 10A-4, the self-correction argument is that in the long run, competition:
(Multiple Choice)
5.0/5 (42)
Filters
- Essay(0)
- Multiple Choice(0)
- Short Answer(0)
- True False(0)
- Matching(0)