Exam 31: Understanding Direct and Inverse Relationships between Variables
Exam 1: Introducing the Economic Way of Thinking85 Questions
Exam 2: Production Possibilities Opportunity Cost and Economic Growth107 Questions
Exam 3: Market Demand and Supply176 Questions
Exam 4: Markets in Action137 Questions
Exam 5: Price Elasticity of Demand and Supply151 Questions
Exam 6: Consumer Choice Theory96 Questions
Exam 7: Production Costs131 Questions
Exam 8: Perfect Competition126 Questions
Exam 9: Monopoly81 Questions
Exam 10: Monopolistic Competition and Oligopoly97 Questions
Exam 11: Labor Markets105 Questions
Exam 12: Income Distribution Poverty and Discrimination57 Questions
Exam 13: Antitrust and Regulation96 Questions
Exam 14: Environmental Economics47 Questions
Exam 15: Gross Domestic Product109 Questions
Exam 16: Business Cycles and Unemployment94 Questions
Exam 17: Inflation56 Questions
Exam 18: The Keynesian Model111 Questions
Exam 19: The Keynesian Model in Action105 Questions
Exam 20: Aggregate Demand and Supply94 Questions
Exam 21: Fiscal Policy108 Questions
Exam 22: The Public Sector55 Questions
Exam 23: Federal Deficits Surpluses and the National Debt42 Questions
Exam 24: Money and the Federal Reserve System75 Questions
Exam 25: Money Creation117 Questions
Exam 26: Monetary Policy106 Questions
Exam 27: The Phillips Curve and Expectations Theory59 Questions
Exam 28: International Trade and Finance127 Questions
Exam 29: Economies in Transition46 Questions
Exam 30: Growth and the Less Developed Countries55 Questions
Exam 31: Understanding Direct and Inverse Relationships between Variables172 Questions
Select questions type
Along an indifference curve for goods X and Y, the vertical and horizontal axes measure the:
(Multiple Choice)
4.9/5  (42)
(42)
Exhibit 6A-1 Budget line
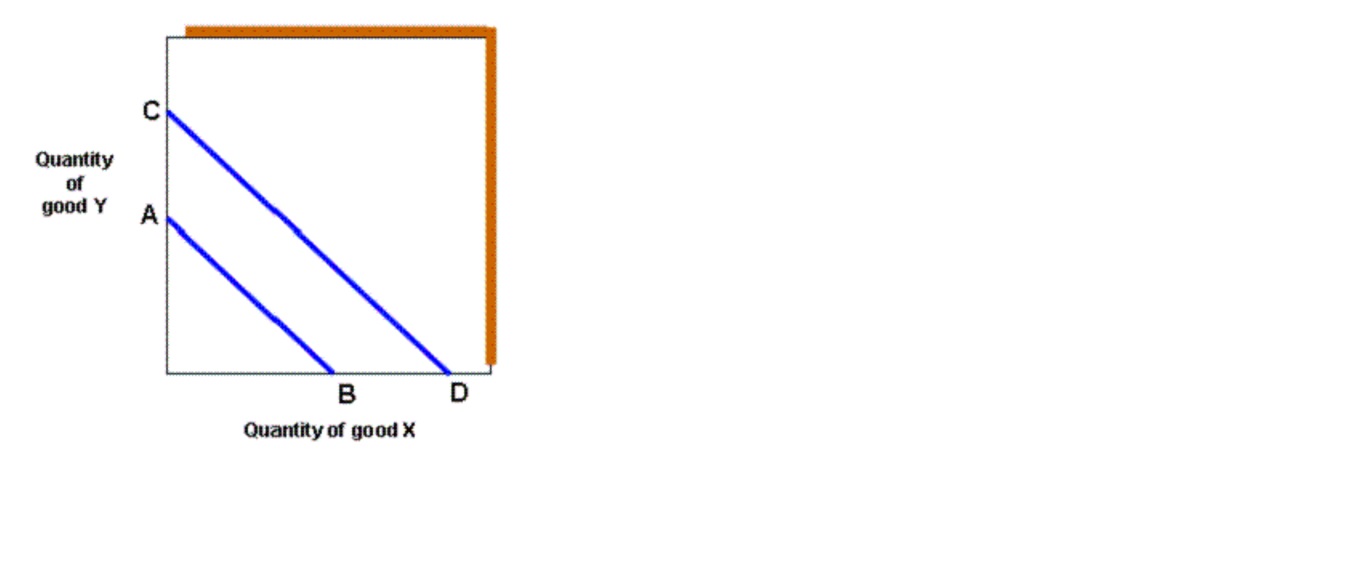 As shown in Exhibit 6A-1, a rightward shift in the budget line from AB to CD would result from:
(Multiple Choice)
4.7/5 (34)
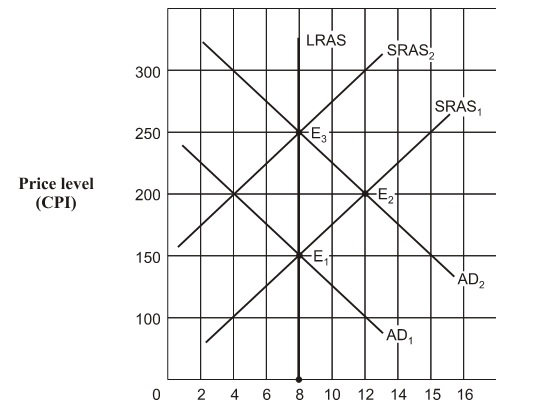
Exhibit 10A-6 Aggregate demand and supply model
 Given the shift of the aggregate demand curve from AD1 to AD2 in Exhibit 10A-6, the real GDP and price level (CPI) in long-run equilibrium will be:
(Multiple Choice)
5.0/5 (31)
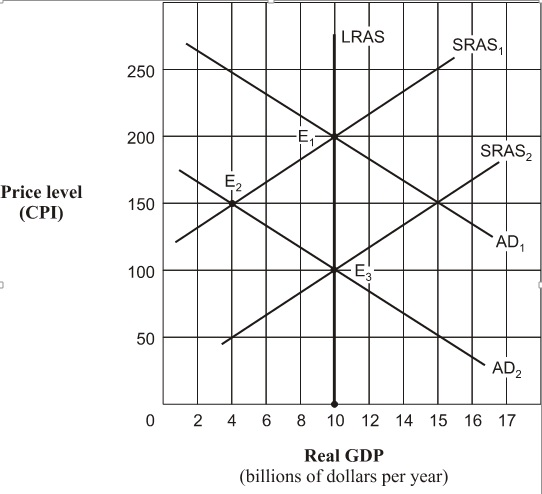
Exhibit 10A-1 Aggregate demand and supply model
 Given the shift of the aggregate demand curve from AD1 to AD2 in Exhibit 10A-1, the real GDP and price level (CPI) in long-run equilibrium will be:
(Multiple Choice)
4.9/5 (31)
Exhibit 16A-2 Macro AD/AS Models
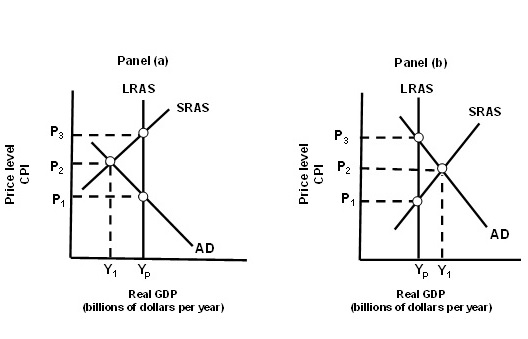 In Panel (a) of Exhibit 16A-2, an expansionary Keynesian government stabilization policy designed to move the economy from Y1 to Yp would shift the:
(Multiple Choice)
4.9/5 (36)
Assume the price of good Y with its quantity measured on the vertical axis is $100 and the price of good X with its quantity measured on the horizontal axis is $10. If the consumer's budget is $500, then the absolute value of the slope of the budget line is:
(Multiple Choice)
4.9/5 (32)
Consumer equilibrium occurs where the budget line is ____ to the ____ possible indifference curve.
(Multiple Choice)
4.8/5 (31)
Assume the economy is operating at a real GDP above full-employment real GDP. Keynesian economists would prescribe which of the following policies?
(Multiple Choice)
4.9/5 (39)
The full-employment level of real GDP is the level which can be produced with:
(Multiple Choice)
4.8/5 (31)
Assume there is a relationship between two variables and the other-variables-held constant assumption (ceteris paribus) is relaxed. We would expect that the line representing this relationship would:
(Multiple Choice)
4.9/5 (32)
If an economy is operating at short-run equilibrium below the level of real GDP, the self-correction model result is that:
(Multiple Choice)
4.8/5 (27)
Exhibit 3A-2 Comparison of Market Efficiency and Deadweight Loss
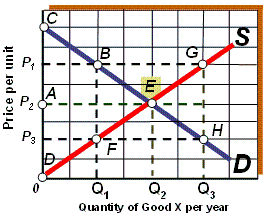 As shown in Exhibit 3A-2, if the market is in equilibrium, then total surplus is represented by
(Multiple Choice)
4.8/5 (33)
A drought destroys much of the peach crop. As a result, consumer surplus in the peach market:
(Multiple Choice)
4.8/5 (37)
If the price of Good X is $2, the price of Good Y is $10 and the consumer's budget is $100, which of the following combinations of Good X and Good Y would be on the budget line?
(Multiple Choice)
4.7/5 (30)
Which of the following causes a leftward shift in the short-run aggregate supply curve?
(Multiple Choice)
4.8/5 (34)
Exhibit 1A-7 Straight line relationship
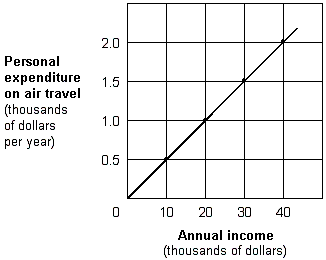 Using the relationship shown in Exhibit 1A-7, suppose the price of air travel increases. How would you revise the graph to show this change?
(Multiple Choice)
4.7/5 (37)
Filters
- Essay(0)
- Multiple Choice(0)
- Short Answer(0)
- True False(0)
- Matching(0)