Exam 16: One-Way Analysis of Variance
Exam 1: Introduction61 Questions
Exam 2: Basic Concepts58 Questions
Exam 3: Displaying Data57 Questions
Exam 4: Measures of Central Tendency55 Questions
Exam 5: Measures of Variability62 Questions
Exam 6: The Normal Distribution59 Questions
Exam 7: Basic Concepts of Probability61 Questions
Exam 8: Sampling Distributions and Hypothesis Testing69 Questions
Exam 9: Correlation71 Questions
Exam 10: Regression66 Questions
Exam 11: Multiple Regression58 Questions
Exam 12: Hypothesis Tests Applied to Means: One Sample67 Questions
Exam 13: Hypothesis Tests Applied to Means: Two Related Samples59 Questions
Exam 14: Hypothesis Tests Applied to Means: Two Independent Samples63 Questions
Exam 15: Power70 Questions
Exam 16: One-Way Analysis of Variance85 Questions
Exam 17: Factorial Analysis of Variance74 Questions
Exam 18: Repeated-Measures Analysis of Variance62 Questions
Exam 19: Chi-Square56 Questions
Exam 20: Nonparametric and Resampling Statistical Tests45 Questions
Exam 21: Meta-Analysis57 Questions
Select questions type
When we speak about error variance in the analysis of variance we are speaking of
(Multiple Choice)
4.8/5  (42)
(42)
When we run a one-way ANOVA with four groups and obtain a significant F , the best effect-size measure to convey what that result tells us is
(Multiple Choice)
4.8/5 (40)
Which of the following is not a multiple comparison procedure we have discussed in class or seen in the texts.
(Multiple Choice)
4.8/5 (31)
The following analysis of variance summary table applies to the next several questions.
 How many subjects were there in this experiment?
(Multiple Choice)
4.8/5 (44)
We want to compare the scores of different groups on a measure of reaction time. Three different groups were studied: patients with recent head injuries, patients with head injuries that occurred a year ago, and a control group of non-injured people. We want to know which group of people has the fastest reaction time. What is the best statistical test to use to find this out?
(Multiple Choice)
4.8/5 (41)
The following analysis of variance summary table applies to the next several questions.
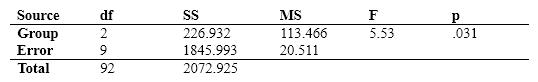 In the experiment whose summary table is given above, the average standard deviation in each of the groups was approximately
(Multiple Choice)
4.7/5 (38)
The analysis of variance differs from a t test for two independent samples because
(Multiple Choice)
4.9/5 (37)
In a one-way analysis of variance we deal with unequal sample sizes by
(Multiple Choice)
4.8/5 (46)
Eysenck's study on recall as a function of level of processing showed
(Multiple Choice)
4.8/5 (34)
The null hypothesis behind a simple multiple-group analysis of variance is of the form:
(Multiple Choice)
4.8/5 (37)
If we want to have faith in the results of our particular study, we will be most concerned with
(Multiple Choice)
4.7/5 (30)
A researcher found significant differences in the mean running speeds of sprinters wearing shoes made by Nike, Reebok, and Adidas using an analysis of variance. The η2 calculated on the basis of group membership (based on which shoes were worn) equaled .16. The value of η2 shows that
(Multiple Choice)
4.9/5 (36)
The grand mean is the mean of all observations across all groups.
(True/False)
4.9/5 (38)
Indicate whether or not each of the following F statistics are significant based on the following information, assuming α = .05.
a. F (4, 120) = 3.26
b. F (2, 60) = 3.10
c. F (6, 500) = 2.14
(Short Answer)
4.9/5 (40)
If the null hypothesis in the analysis of variance were true,
(Multiple Choice)
4.8/5 (37)
Filters
- Essay(0)
- Multiple Choice(0)
- Short Answer(0)
- True False(0)
- Matching(0)