Exam 3: Displaying Data
Exam 1: Introduction61 Questions
Exam 2: Basic Concepts58 Questions
Exam 3: Displaying Data57 Questions
Exam 4: Measures of Central Tendency55 Questions
Exam 5: Measures of Variability62 Questions
Exam 6: The Normal Distribution59 Questions
Exam 7: Basic Concepts of Probability61 Questions
Exam 8: Sampling Distributions and Hypothesis Testing69 Questions
Exam 9: Correlation71 Questions
Exam 10: Regression66 Questions
Exam 11: Multiple Regression58 Questions
Exam 12: Hypothesis Tests Applied to Means: One Sample67 Questions
Exam 13: Hypothesis Tests Applied to Means: Two Related Samples59 Questions
Exam 14: Hypothesis Tests Applied to Means: Two Independent Samples63 Questions
Exam 15: Power70 Questions
Exam 16: One-Way Analysis of Variance85 Questions
Exam 17: Factorial Analysis of Variance74 Questions
Exam 18: Repeated-Measures Analysis of Variance62 Questions
Exam 19: Chi-Square56 Questions
Exam 20: Nonparametric and Resampling Statistical Tests45 Questions
Exam 21: Meta-Analysis57 Questions
Select questions type
In making plots of data, which of the following rules is true?
(Multiple Choice)
4.9/5  (40)
(40)
The next six questions are based on the following data. 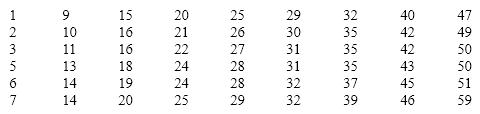 -Is the distribution symmetrical?
(Essay)
4.9/5 (33)
Which of the following is the least important characteristic of graphics?
(Multiple Choice)
4.7/5 (36)
The Center for Disease Control has published statistics relating maternal smoking to low birth weight. The data follow in terms of the percentage of birth weights
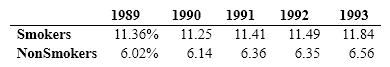 Which of the following ways of presenting the data would be most informative?
(Multiple Choice)
4.9/5 (38)
If you created a stem-and-leaf display of the math SAT scores of all entering students in a large Midwestern state university, the stem would best be
(Multiple Choice)
4.9/5 (43)
Someone asks you if you have seen the movie Titanic . Before you answer, you look back into your memory for all of the movies you have ever seen and review the titles one at a time. This is an example of
(Multiple Choice)
4.8/5 (37)
"5s" represents what numbers on a stem-and-leaf display according to Tukey?
(Multiple Choice)
4.7/5 (44)
The next six questions are based on the following data.
-Create a histogram for these data using an interval of 5 (e.g., 0 to 5, 6 to 10).
(Essay)
4.9/5 (44)
Assume that you have a set of data with 70 values spread fairly evenly between 0 and 100. The optimal number of categories for a histogram of these data would be approximately
(Multiple Choice)
4.9/5 (34)
For the data referred to in the previous question, the distribution would best be called
(Multiple Choice)
4.8/5 (38)
In deciding on the number of stems to use in a stem and leaf display,
(Multiple Choice)
4.9/5 (36)
A data set of test scores consisted of the following:
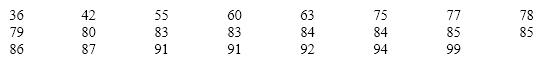 On a stem-and-leaf display, the values of the tens digits (3 - 9) are
(Multiple Choice)
4.8/5 (37)
Filters
- Essay(0)
- Multiple Choice(0)
- Short Answer(0)
- True False(0)
- Matching(0)