Exam 5: Measures of Variability
Exam 1: Introduction61 Questions
Exam 2: Basic Concepts58 Questions
Exam 3: Displaying Data57 Questions
Exam 4: Measures of Central Tendency55 Questions
Exam 5: Measures of Variability62 Questions
Exam 6: The Normal Distribution59 Questions
Exam 7: Basic Concepts of Probability61 Questions
Exam 8: Sampling Distributions and Hypothesis Testing69 Questions
Exam 9: Correlation71 Questions
Exam 10: Regression66 Questions
Exam 11: Multiple Regression58 Questions
Exam 12: Hypothesis Tests Applied to Means: One Sample67 Questions
Exam 13: Hypothesis Tests Applied to Means: Two Related Samples59 Questions
Exam 14: Hypothesis Tests Applied to Means: Two Independent Samples63 Questions
Exam 15: Power70 Questions
Exam 16: One-Way Analysis of Variance85 Questions
Exam 17: Factorial Analysis of Variance74 Questions
Exam 18: Repeated-Measures Analysis of Variance62 Questions
Exam 19: Chi-Square56 Questions
Exam 20: Nonparametric and Resampling Statistical Tests45 Questions
Exam 21: Meta-Analysis57 Questions
Select questions type
If we eliminate the top and bottom 25% of the data and take the range of what remains we have the
(Multiple Choice)
4.9/5  (28)
(28)
Answer the following questions based on this distribution of exam scores.
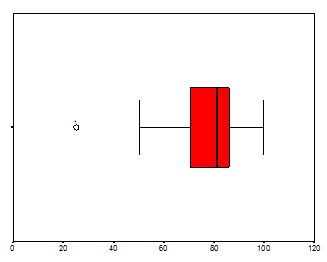 a. What is the median?
b. Are there outliers?
c. Does the distribution seem skewed? If so, is it positively, or negatively skewed?
a. What is the median?
b. Are there outliers?
c. Does the distribution seem skewed? If so, is it positively, or negatively skewed?
(Essay)
4.7/5 (41)
Of all of the measures of variability, the standard deviation is most susceptible to distortion due to outliers.
(True/False)
4.8/5 (40)
We normally compute the variance using N - 1 in the denominator because
(Multiple Choice)
4.7/5 (40)
Construct two small sets of data that have the same mean, but a different standard deviation.
(Essay)
4.8/5 (39)
If I continue to draw observations from a population and recalculate the mean each time I add an observation, the mean will approach _______ as the sample size increases.
(Multiple Choice)
4.9/5 (38)
The difference between the lowest to the highest score in a distribution is the range.
(True/False)
4.9/5 (31)
We generally like the standard deviation when we are trying to describe a sample of data because
(Multiple Choice)
4.9/5 (47)
The US Census Bureau collected data on family composition and found that samples from different parts of the country gave very different results for the mean number of family members living in households. If all of the data were combined to one data set,
(Multiple Choice)
4.9/5 (35)
Filters
- Essay(0)
- Multiple Choice(0)
- Short Answer(0)
- True False(0)
- Matching(0)