Exam 2: The Physical Environment
Exam 1: The Web of Life68 Questions
Exam 2: The Physical Environment76 Questions
Exam 3: The Biosphere73 Questions
Exam 4: Coping With Environmental Variation:74 Questions
Exam 5: Coping With Environmental Variation: Energy71 Questions
Exam 6: Evolution and Ecology68 Questions
Exam 7: Life History69 Questions
Exam 8: Behavioral Ecology71 Questions
Exam 9: Population Distribution and Abundance80 Questions
Exam 10: Population Dynamics68 Questions
Exam 11: Population Growth and Regulation69 Questions
Exam 12: Predation70 Questions
Exam 13: Parasitism72 Questions
Exam 14: Competition74 Questions
Exam 15: Mutualism and Commensalism71 Questions
Exam 16: The Nature of Communities71 Questions
Exam 17: Change in Communities73 Questions
Exam 18: Biogeography70 Questions
Exam 19: Species Diversity in Communities72 Questions
Exam 20: Production73 Questions
Exam 21: Energy Flow and Food Webs76 Questions
Exam 22: Nutrient Supply and Cycling76 Questions
Exam 23: Conservation Biology73 Questions
Exam 24: Landscape Ecology and Ecosystem Management71 Questions
Exam 25: Global Ecology74 Questions
Select questions type
It is _______ in mountains and highlands when compared to lowlands because _______.
(Multiple Choice)
4.9/5  (40)
(40)
Refer to the figure.
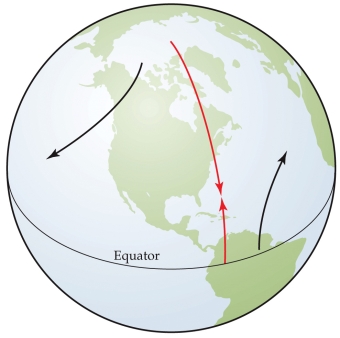 The figure illustrates the Coriolis effect for Earth. Which of the following statements about the Coriolis effect is false?
(Multiple Choice)
4.7/5 (34)
A leak from an oil pipeline is flowing into an Alaskan lake that is approximately 1 km wide and 20 m deep. When oil spills into a body of water, much of it floats on top but some can adhere to tiny particles in the water column and be carried into deeper water. Suppose the oil leak occurs during early summer. The oil impacts not only the lake but also the surrounding vegetation, causing trees, bushes, and other plants to die off over the course of the summer. What effect would this have on the local albedo and evapotranspiration around the lake? Would you expect the lake to heat up more or less than it would during normal years? Which layer of the lake would be most affected?
(Essay)
5.0/5 (30)
If the Earth rotated around its axis from east to west rather than west to east, what major consequences would this have had for the standard routes traversed by sailing ships traveling between Europe or Africa and the Americas prior to the 20th century?
(Essay)
4.8/5 (40)
Refer to the figure.
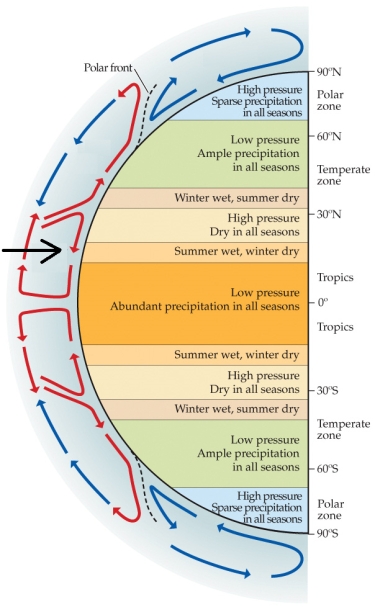 What is the name of the circulation pattern indicated by the black arrow?
(Multiple Choice)
4.8/5 (27)
Refer to the figure.
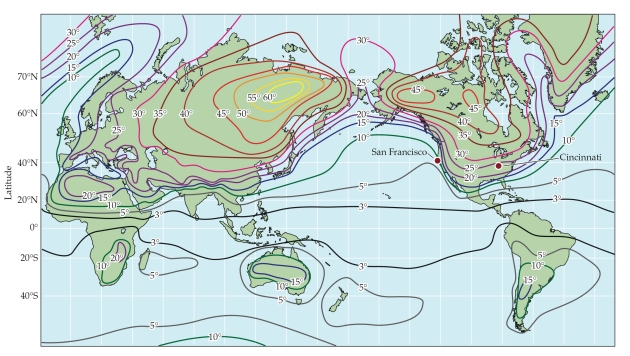 The figure shows seasonal temperature variation expressed as the difference in average monthly temperature between the warmest and coldest months (in ℃). San Francisco and Cincinnati are located at similar latitudes in North America. Based on the figure, which of these two cities experiences less temperature differential between winter and summer? Explain why.
(Essay)
4.7/5 (36)
In the absence of greenhouse gases, Earth would be about _______ than it is now.
(Multiple Choice)
4.9/5 (33)
Earth's surface releases _______ it receives by solar radiation. Additional energy inputs to Earth's surface occur in part from back radiation due to _______.
(Multiple Choice)
4.8/5 (34)
During the summer, temperatures and plankton activity in temperate lakes are highest in the _______. This is also the period of _______ lake stratification.
(Multiple Choice)
4.7/5 (32)
Which areas of Earth receive the most precipitation on average?
(Multiple Choice)
4.8/5 (40)
The side of a mountain range that faces into the prevailing winds is called the _______ side. This usually receives _______ precipitation than the other side of the mountain.
(Multiple Choice)
4.7/5 (45)
On what time scale does the El Niño Southern Oscillation (ENSO) occur?
(Multiple Choice)
4.9/5 (37)
Deforestation in the tropics should result in a(n) _______ in the land's ability to reflect solar energy and _______ latent heat transfer.
(Multiple Choice)
4.7/5 (42)
Refer to the figure.
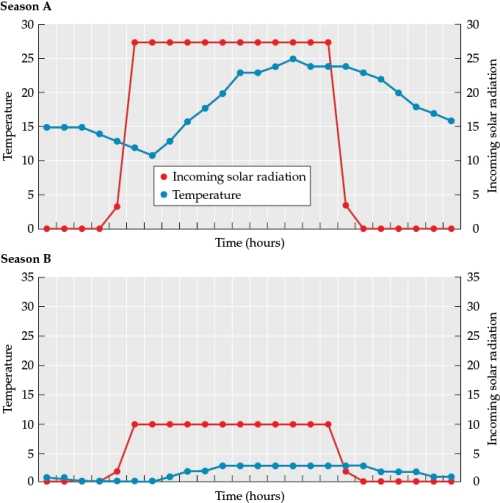 -You are one of a team of scientists studying a newly-discovered planet. You are receiving data from a probe that was landed on the planet by an unmanned mission. Your team is working with the little data you have from the probe to learn as much as you can about the planet's basic characteristics. The figure illustrates data collected by the probe at the same location on the planet during what you suspect are two different seasons (season A and season B). If plants from Earth's temperate deciduous forests could grow on this new planet, during which season(s) would they most likely show the most active growth? What other information would be required to determine probable growth patterns?
(Essay)
4.9/5 (41)
The greatest seasonal variation of temperature is most likely to be seen over
(Multiple Choice)
4.8/5 (33)
Which statement about atmospheric circulation patterns is false?
(Multiple Choice)
4.8/5 (36)
Which phenomenon is a major cause of the periodic glacial advances and retreats that have occurred over the last two million years?
(Multiple Choice)
4.7/5 (32)
Filters
- Essay(0)
- Multiple Choice(0)
- Short Answer(0)
- True False(0)
- Matching(0)