Exam 2: Descriptive Statistics
Exam 1: Introduction30 Questions
Exam 2: Descriptive Statistics60 Questions
Exam 3: Data Visualization61 Questions
Exam 4: Linear Regression60 Questions
Exam 5: Time Series Analysis and Forecasting58 Questions
Exam 6: Data Mining60 Questions
Exam 7: Spreadsheet Models60 Questions
Exam 8: Linear Optimization Models60 Questions
Exam 9: Integer Linear Optimization Models60 Questions
Exam 10: Nonlinear Optimization Models60 Questions
Exam 11: Monte Carlo Simulation59 Questions
Exam 12: Decision Analysis60 Questions
Select questions type
Identify the shape of the distribution in the below figure. 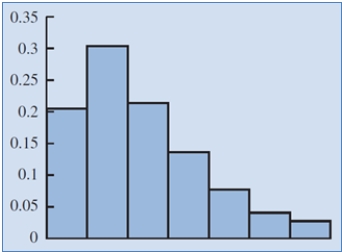
(Multiple Choice)
4.9/5  (43)
(43)
Any data value with a z-score less than -3 or greater than +3 is treated as a(n)
(Multiple Choice)
4.9/5 (41)
Which of the following are necessary to be determined to define the classes for a frequency distribution with quantitative data?
(Multiple Choice)
4.8/5 (41)
A summary of data that shows the number of observations in each of several nonoverlapping bins is called
(Multiple Choice)
4.7/5 (34)
A student willing to participate in a debate competition required to fill a registration form. State whether each of the following information about the participant provides categorical or quantitative data.
a. What is your date of birth?
b. Have you participated in any debate competition previously?
c. If yes, how many debate competitions have you participated so far?
d. Have you won any of the competitions?
e. If yes, how many have you won?
(Essay)
4.8/5 (37)
The data on the percentage of visitors in the previous and current years at 12 well-known national parks of Unites States are given below:
 a. Sort the parks in descending order by their current year's visitor percentage. Which park has the highest number of visitors in the current year? Which park has the lowest number of visitors in the current year?
b. Calculate the change in visitor percentage from the previous to the current year for each park. Use Excel's conditional formatting to highlight the park whose visitor percentage decreased from the previous year to the current year.
c. Use Excel's conditional formatting tool to create data bars for the change in visitor percentage from the previous year to the current year for each park calculated in part b.
a. Sort the parks in descending order by their current year's visitor percentage. Which park has the highest number of visitors in the current year? Which park has the lowest number of visitors in the current year?
b. Calculate the change in visitor percentage from the previous to the current year for each park. Use Excel's conditional formatting to highlight the park whose visitor percentage decreased from the previous year to the current year.
c. Use Excel's conditional formatting tool to create data bars for the change in visitor percentage from the previous year to the current year for each park calculated in part b.
(Essay)
4.9/5 (29)
The difference in a variable measured over observations (time, customers, items, etc.) is called as _____.
(Multiple Choice)
4.8/5 (38)
A _____ determines how far a particular value is from the mean relative to the data set's standard deviation.
(Multiple Choice)
4.7/5 (28)
Compute the 50th percentile for the following data:
10 15 17 21 25 12 16 11 13 22
(Multiple Choice)
4.8/5 (30)
The _____ is a point estimate of the population mean for the variable of interest.
(Multiple Choice)
4.9/5 (42)
A study on the average minutes spent by students on internet usage is 300 with a standard deviation of 102. Answer the following questions assuming a bell-shaped distribution and using the empirical rule.
a. What percentage of students use internet for more than 402 minutes?
b. What percentage of students use internet for more than 504 minutes?
c. What percentage of students use internet between 198 minutes and 300 minutes?
(Essay)
4.8/5 (32)
_____ is a graphical summary of data previously summarized in a frequency distribution.
(Multiple Choice)
4.7/5 (29)
The following table provides information on the number of billionaires in a country and the continents on which these countries are located.
 a. Sort the countries from largest to smallest based on the number of billionaires. What are the top 5 countries according to the number of billionaires?
b. Filter the countries to display only the countries located in North America.
a. Sort the countries from largest to smallest based on the number of billionaires. What are the top 5 countries according to the number of billionaires?
b. Filter the countries to display only the countries located in North America.
(Essay)
4.8/5 (41)
A set of values corresponding to a set of variables is defined as a(n) _____.
(Multiple Choice)
4.9/5 (38)
Which of the following gives the proportion of items in each bin?
(Multiple Choice)
4.9/5 (28)
The partial relative frequency distribution is given below:
 a. What is the relative frequency of group 4?
b. The total sample size is 400. What is the frequency of group 4?
c. Show the frequency distribution.
d. Show the percent frequency distribution.
a. What is the relative frequency of group 4?
b. The total sample size is 400. What is the frequency of group 4?
c. Show the frequency distribution.
d. Show the percent frequency distribution.
(Essay)
4.8/5 (42)
Which of the following graphs provide information on outliers and IQR of a data set?
(Multiple Choice)
4.9/5 (41)
_____ provide facts and figures that can be used for analysis and interpretation of a population of interest.
(Multiple Choice)
4.8/5 (40)
Filters
- Essay(0)
- Multiple Choice(0)
- Short Answer(0)
- True False(0)
- Matching(0)