Exam 5: Time Series Analysis and Forecasting
Exam 1: Introduction30 Questions
Exam 2: Descriptive Statistics60 Questions
Exam 3: Data Visualization61 Questions
Exam 4: Linear Regression60 Questions
Exam 5: Time Series Analysis and Forecasting58 Questions
Exam 6: Data Mining60 Questions
Exam 7: Spreadsheet Models60 Questions
Exam 8: Linear Optimization Models60 Questions
Exam 9: Integer Linear Optimization Models60 Questions
Exam 10: Nonlinear Optimization Models60 Questions
Exam 11: Monte Carlo Simulation59 Questions
Exam 12: Decision Analysis60 Questions
Select questions type
_____ is the amount by which the predicted value differs from the observed value of the time series variable.
Free
(Multiple Choice)
4.7/5  (28)
(28)
Correct Answer: Verified
D
Qualitative forecasting methods are used when:
Free
(Multiple Choice)
4.8/5 (29)
Correct Answer:Verified
C
The following data shows the quarterly profit (in thousands of dollars) made by a particular company in the past 3 years.
 a. Construct a time series plot. What type of pattern exists in the data?
b. Develop a three-period moving average for this time series. Compute MSE and a forecast of profit (in $1000s) for the next quarter.
a. Construct a time series plot. What type of pattern exists in the data?
b. Develop a three-period moving average for this time series. Compute MSE and a forecast of profit (in $1000s) for the next quarter.
(Essay)
4.9/5 (35)
The below time series gives the indices of Industrial Production in U.S for 10 consecutive years.
 a. Construct a time series plot. What type of pattern exists in the data?
b. Use simple linear regression analysis to find the parameters for the line that minimizes MSE for this time series.
c. What is the forecast for t = 11?
a. Construct a time series plot. What type of pattern exists in the data?
b. Use simple linear regression analysis to find the parameters for the line that minimizes MSE for this time series.
c. What is the forecast for t = 11?
(Essay)
4.8/5 (40)
Which of the following states the objective of time series analysis?
(Multiple Choice)
5.0/5 (35)
Consider the following time series:
 a. Construct a time series plot. What type of pattern exists in the data?
b. Use simple linear regression analysis to find the parameters for the line that minimizes MSE for this time series.
c. What is the forecast for t = 9?
a. Construct a time series plot. What type of pattern exists in the data?
b. Use simple linear regression analysis to find the parameters for the line that minimizes MSE for this time series.
c. What is the forecast for t = 9?
(Essay)
4.9/5 (41)
Which of the following statements is the objective of the moving averages and exponential smoothing methods?
(Multiple Choice)
4.8/5 (39)
Which of the following data patterns best describes the scenario shown in the below plot? 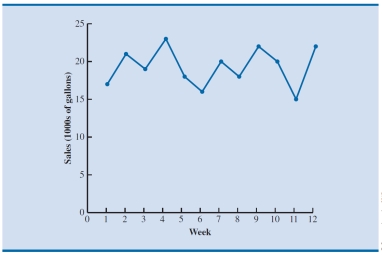
(Multiple Choice)
4.8/5 (33)
Consider the following quarterly time series:
 a. Construct a time series plot. What type of pattern exists in the data?
b. Use a multiple regression model with dummy variables as follows to develop an equation to account for seasonal effects in the data. Qtr1 = 1 if quarter 1, 0 otherwise; Qtr2 = 1 if quarter 2, 0 otherwise; Qtr3 = 1 if quarter 3, 0 otherwise.
c. Compute the quarterly forecasts for next year based on the model developed in part b.
a. Construct a time series plot. What type of pattern exists in the data?
b. Use a multiple regression model with dummy variables as follows to develop an equation to account for seasonal effects in the data. Qtr1 = 1 if quarter 1, 0 otherwise; Qtr2 = 1 if quarter 2, 0 otherwise; Qtr3 = 1 if quarter 3, 0 otherwise.
c. Compute the quarterly forecasts for next year based on the model developed in part b.
(Essay)
4.7/5 (42)
The following times series shows the demand for a particular product over the past 10 months.
 a. Use α = 0.2 to compute the exponential smoothing values for the time series. Compute MSE and a forecast for month 11.
b. Compare the three-month moving average forecast with the exponential smoothing forecast using α = 0.2. Which appears to provide the better forecast based on MSE?
a. Use α = 0.2 to compute the exponential smoothing values for the time series. Compute MSE and a forecast for month 11.
b. Compare the three-month moving average forecast with the exponential smoothing forecast using α = 0.2. Which appears to provide the better forecast based on MSE?
(Essay)
4.9/5 (33)
Consider the following time series:
 a. Use a multiple regression model to develop an equation to account for linear trend and seasonal effects in the data. To capture seasonal effects, use the dummy variables Qtr1 = 1 if quarter 1, 0 otherwise; Qtr2 = 1 if quarter 2, 0 otherwise; Qtr3 = 1 if quarter 3, 0 otherwise; and create a variable t such that t = 1 for quarter 1 in year 1, t = 2 for quarter 2 in year 1, … ,t = 12 for quarter 4 in year 3.
b. Compute the quarterly forecasts for next year based on the model developed in part a.
a. Use a multiple regression model to develop an equation to account for linear trend and seasonal effects in the data. To capture seasonal effects, use the dummy variables Qtr1 = 1 if quarter 1, 0 otherwise; Qtr2 = 1 if quarter 2, 0 otherwise; Qtr3 = 1 if quarter 3, 0 otherwise; and create a variable t such that t = 1 for quarter 1 in year 1, t = 2 for quarter 2 in year 1, … ,t = 12 for quarter 4 in year 3.
b. Compute the quarterly forecasts for next year based on the model developed in part a.
(Essay)
4.8/5 (38)
A time series that shows a recurring pattern over one year or less is said to follow a _____.
(Multiple Choice)
4.9/5 (37)
For causal modeling, _____ are used to detect linear or nonlinear relationships between the independent and dependent variables.
(Multiple Choice)
4.8/5 (27)
Which of the following is true of a stationary time series?
(Multiple Choice)
4.8/5 (30)
The following time series shows the sales of a particular commodity over the past 15 weeks.
 a. Construct a time series plot. What type of pattern exists in the data?
b. Use α = 0.3 to develop the exponential smoothing values for the time series and compute the forecast of demand for the next week.
c. Use trial and error to find a value of the exponential smoothing coefficient α that results in a relatively small MSE.
a. Construct a time series plot. What type of pattern exists in the data?
b. Use α = 0.3 to develop the exponential smoothing values for the time series and compute the forecast of demand for the next week.
c. Use trial and error to find a value of the exponential smoothing coefficient α that results in a relatively small MSE.
(Essay)
4.8/5 (26)
With reference to time series data patterns, a cyclical pattern is the component of the time series that:
(Multiple Choice)
4.8/5 (40)
Consider the following time series data:
 a. Use α = 0.2 to compute the exponential smoothing values for the time series. Compute MSE and a forecast for year 11.
b. Use trial and error to find a value of the exponential smoothing coefficient α that results in a smaller MSE than what you calculated for α = 0.2.
c. Compute the forecast for year 11 using the smoothing coefficient α selected using trial error.
a. Use α = 0.2 to compute the exponential smoothing values for the time series. Compute MSE and a forecast for year 11.
b. Use trial and error to find a value of the exponential smoothing coefficient α that results in a smaller MSE than what you calculated for α = 0.2.
c. Compute the forecast for year 11 using the smoothing coefficient α selected using trial error.
(Essay)
4.9/5 (33)
The yearly sales (in millions of dollars) of an automobile manufacturing company during the period 2000-2011 are given below:
 a. Construct a time series plot. What type of pattern exists in the data?
b. Use simple linear regression analysis to find the parameters for the line that minimizes MSE for this time series.
c. What is the sales forecast (in millions of dollars) for the year 2012?
a. Construct a time series plot. What type of pattern exists in the data?
b. Use simple linear regression analysis to find the parameters for the line that minimizes MSE for this time series.
c. What is the sales forecast (in millions of dollars) for the year 2012?
(Essay)
4.8/5 (36)
The monthly sales (in hundreds of dollars) of a company are listed below.
 a. Construct a time series plot. What type of pattern exists in the data?
b. Use simple linear regression analysis to find the parameters for the line that minimizes MSE for this time series.
c. What is the sales forecast (in hundreds of dollars) for next month?
a. Construct a time series plot. What type of pattern exists in the data?
b. Use simple linear regression analysis to find the parameters for the line that minimizes MSE for this time series.
c. What is the sales forecast (in hundreds of dollars) for next month?
(Essay)
4.8/5 (37)
Filters
- Essay(0)
- Multiple Choice(0)
- Short Answer(0)
- True False(0)
- Matching(0)