Exam 6: Data Mining
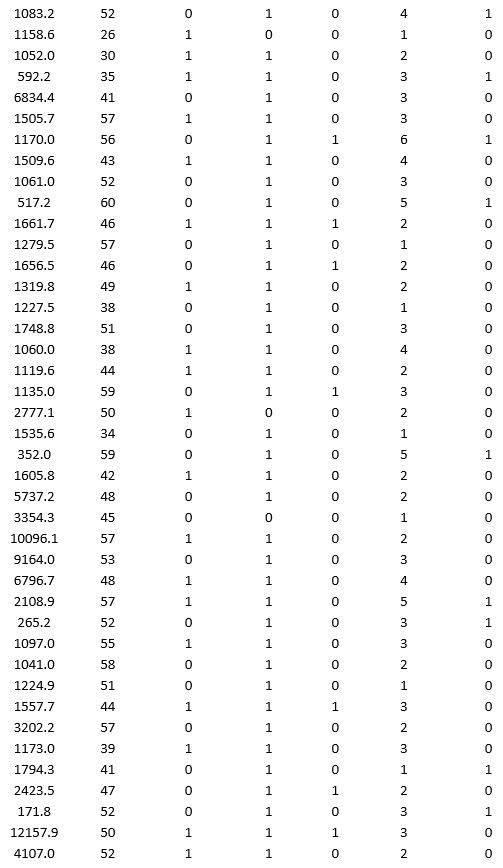
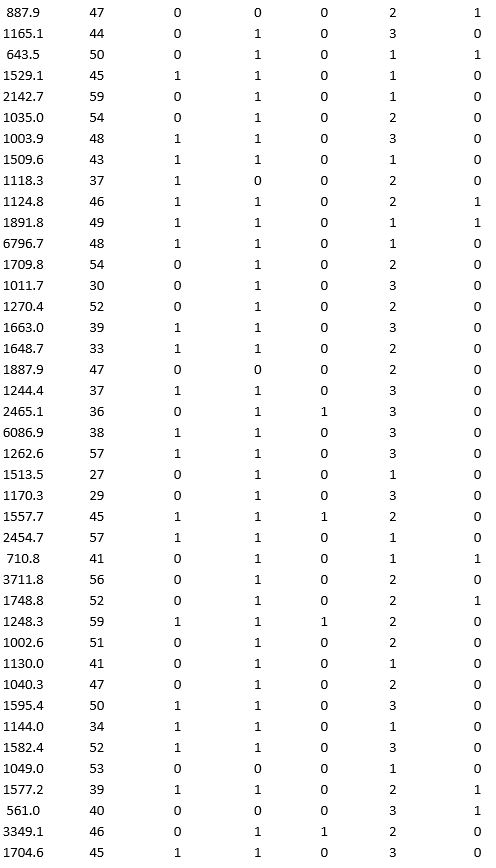
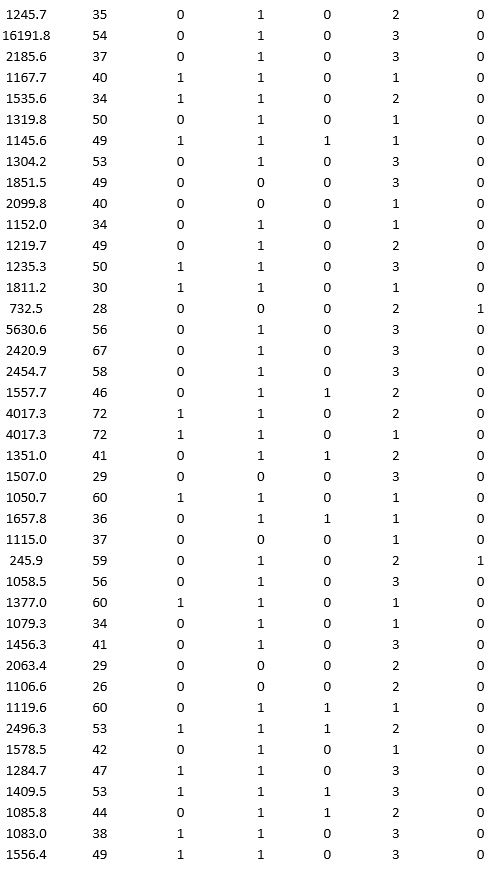
A retailer is interested in analyzing the shopping trend of men concerning the items: Shirts, pants, Jeans, t-shirts, Shoes, and Belts. A sample of 50 male customers is selected and the data are given below.
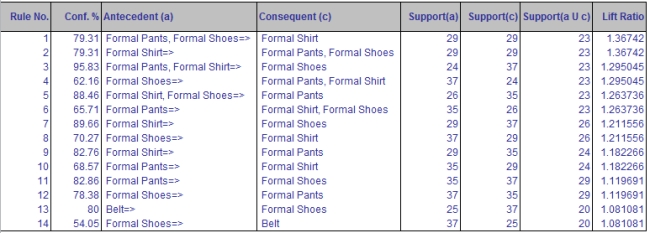
 a. Using a minimum support of 20 transactions and a minimum confidence of 50 percent, use XLMiner to generate a list of association rules. How many rules satisfy this criterion?
b. Using the list of rules from part a, consider the rule with the largest lift ratio. Interpret what this rule is saying about the relationship between the antecedent item set and consequent item set.
c. Interpret the support count of the item set composed of the all the items involved in the rule with the largest lift ratio.
d. Interpret the confidence of the rule with the largest lift ratio.
e. Interpret the lift ratio of the rule with the largest lift ratio.
a. Using a minimum support of 20 transactions and a minimum confidence of 50 percent, use XLMiner to generate a list of association rules. How many rules satisfy this criterion?
b. Using the list of rules from part a, consider the rule with the largest lift ratio. Interpret what this rule is saying about the relationship between the antecedent item set and consequent item set.
c. Interpret the support count of the item set composed of the all the items involved in the rule with the largest lift ratio.
d. Interpret the confidence of the rule with the largest lift ratio.
e. Interpret the lift ratio of the rule with the largest lift ratio.
a. 14 rules have a support count of at least 20 and a confidence of 50%.
b. Antecedent: Formal Pants, Formal shoes; Consequent: Formal shirt. If a customer purchases formal pants and Formal shoes, then he also purchases formal shirts.
c. The support count of the item set involved in this rule is 23 meaning that Formal pants and Formal shirt, Formal shoes have been purchased 23 times together.
d. The confidence of this rule is 79.31% which means that of the 29 times Formal pants and Formal shoes were purchased, 23 times Formal shirts were also purchased.
e. The lift ratio of this rule is 1.37 which means that a customer purchasing Formal pants and Formal shoes and who also purchased Formal shirts is 37% more likely than a randomly selected customer who purchased Formal shoes.
In the k-nearest neighbors method, when the value of k is set to 1,:
A
_____ is a category of data-mining techniques in which an algorithm learns how to predict or classify an outcome variable of interest.
A
_____ is a measure of calculating dissimilarity between clusters by considering the distance between the cluster centroids.
The simplest measure of similarity between observations consisting solely of categorical variables is given by _____.
A bank wants to understand better the details of customers who are likely to default the loan. In order to analyze this, the data from a random sample of 200 customers are given below:

 In XLMiner's Partition with Oversampling procedure, partition the data so there is 50 percent successes (Loan default) in the training set and 40 percent of the validation data are taken away as test data. Construct a logistic regression model using Loan default as the output variable and all the other variables as input variables. Perform an exhaustive-search best subset selection with the number of best subsets equal to 2. Generate lift charts for both the validation data and test data.
a. From the generated set of logistic regression models, select one that is a good fit. Express the model as a mathematical equation relating the output variable to the input variables. Do the relationships suggested by the model make sense? Try to explain them.
b. Using the default cutoff value of 0.5 for your logistic regression model, what is the overall error rate on the test data?
c. Examine the decile-wise lift chart for your model on the test data. What is the first decile lift? Interpret this value.
In XLMiner's Partition with Oversampling procedure, partition the data so there is 50 percent successes (Loan default) in the training set and 40 percent of the validation data are taken away as test data. Construct a logistic regression model using Loan default as the output variable and all the other variables as input variables. Perform an exhaustive-search best subset selection with the number of best subsets equal to 2. Generate lift charts for both the validation data and test data.
a. From the generated set of logistic regression models, select one that is a good fit. Express the model as a mathematical equation relating the output variable to the input variables. Do the relationships suggested by the model make sense? Try to explain them.
b. Using the default cutoff value of 0.5 for your logistic regression model, what is the overall error rate on the test data?
c. Examine the decile-wise lift chart for your model on the test data. What is the first decile lift? Interpret this value.
The process of reducing the number of variables to consider in a data-mining approach without losing any crucial information is termed as _____.
A _____ classifies a categorical outcome variable by splitting observations into groups via a sequence of hierarchical rules.
The estimation of the value for a continuous outcome is done during _____.
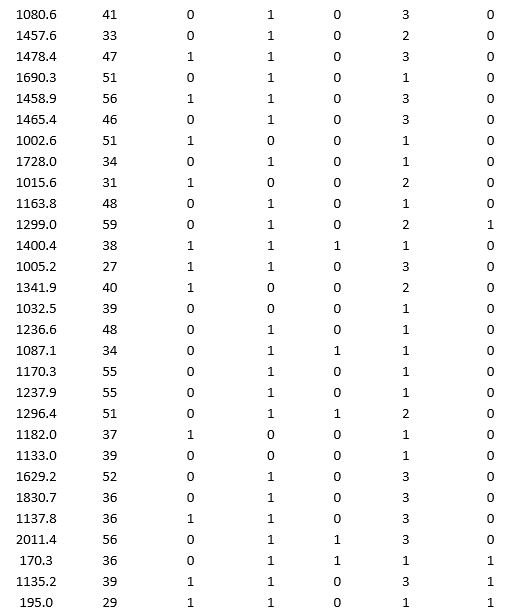
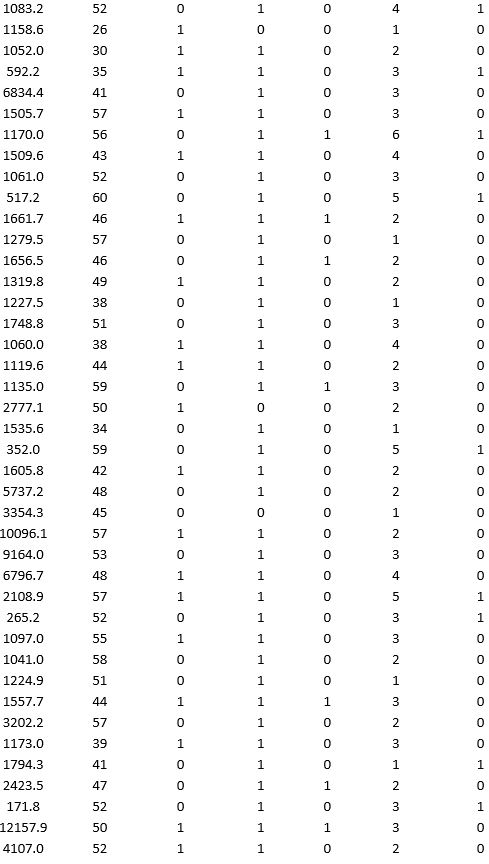
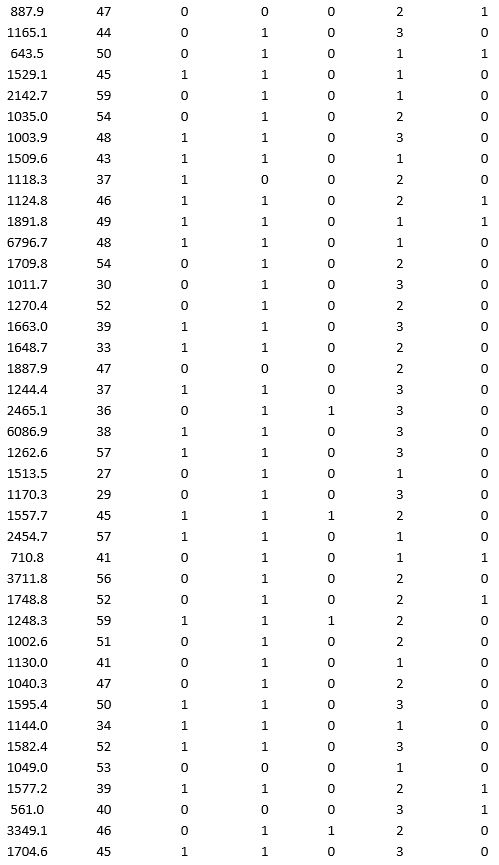
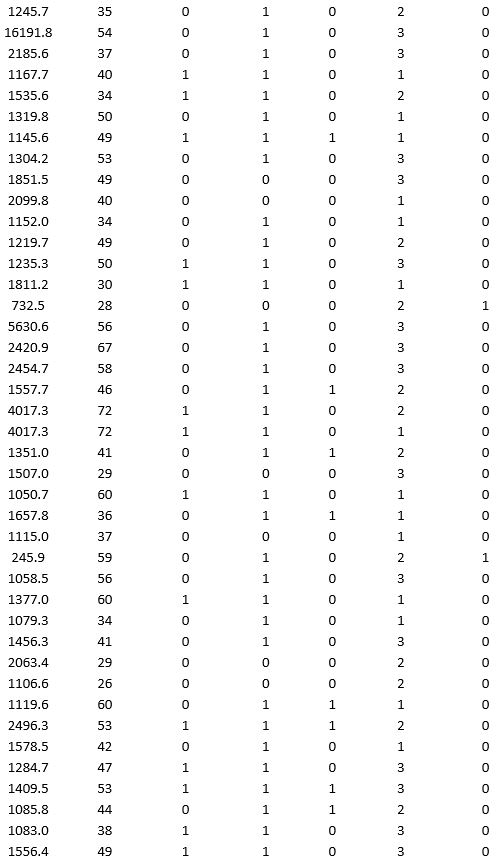
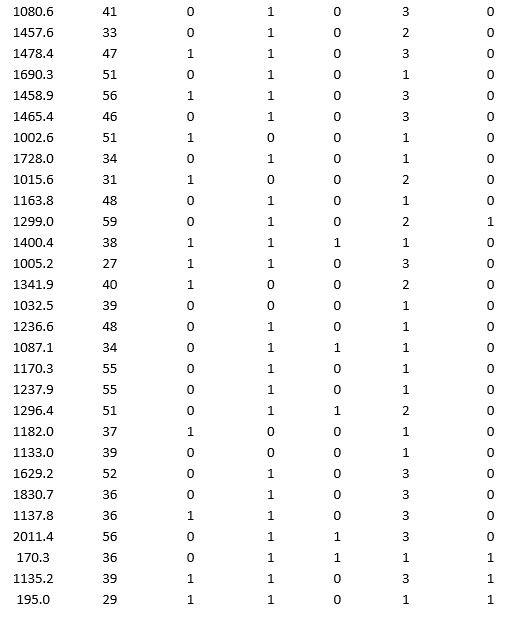
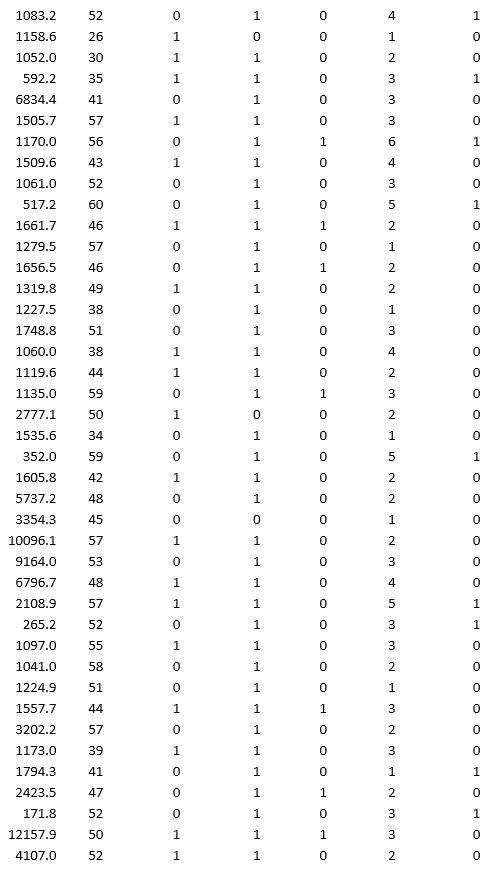
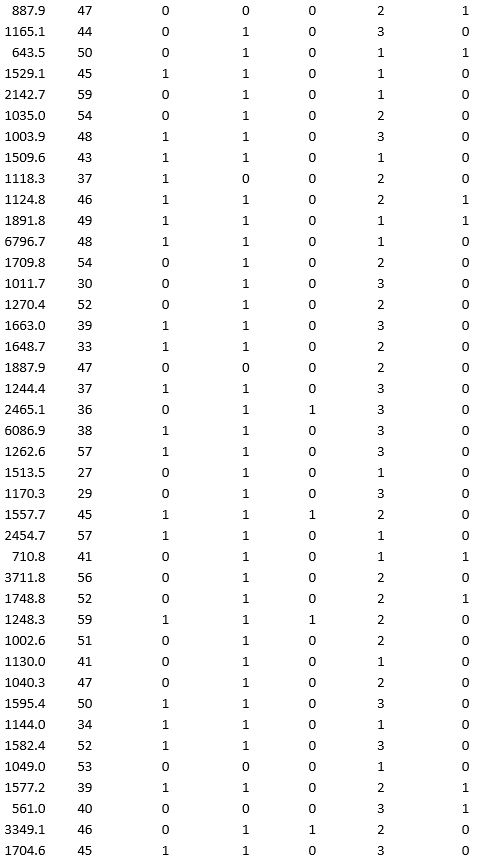
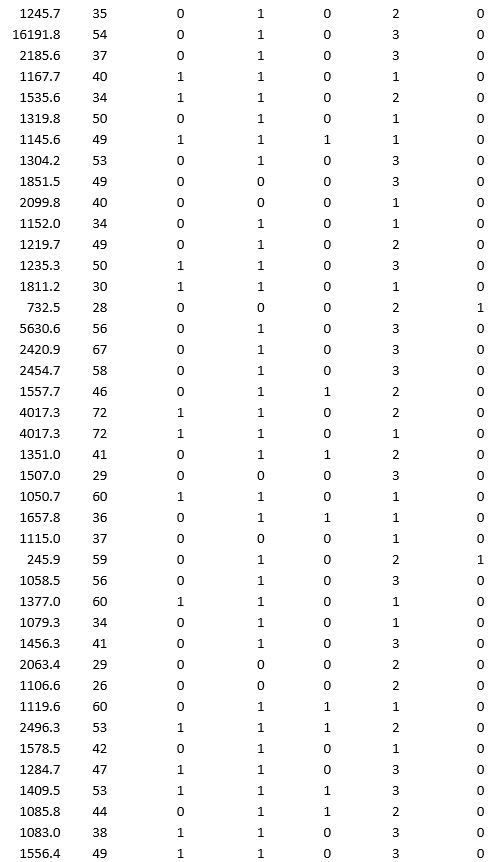
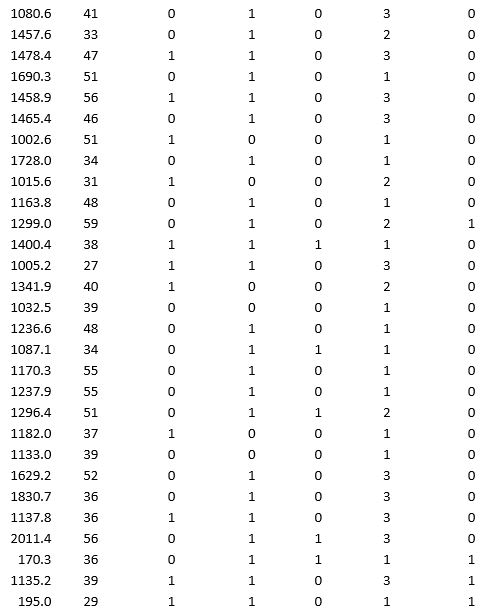
A research team wanted to assess the relationship between age, systolic blood pressure, smoking, and risk of stroke. A sample of 150 patients who had a stroke is selected and the data collected are given below. Here, for the variable Smoker, 1 represents smokers and 0 represents nonsmokers.

 Partition the data into training (50 percent), validation (30 percent), and test (20 percent) sets. Predict the Risk of stroke using a regression tree. Use Risk as the output variable and all the other variables as input variables. In Step 2 of XLMiner's Regression Tree procedure, be sure to Normalize input data, to set the Maximum #splits for input variables to 74, to set the Minimum #records in a terminal node to 1, and specify Using Best prune tree as the scoring option. In Step 3 of XLMiner's Regression Tree procedure, set the maximum number of levels to 7. Generate the Full tree, Best pruned tree, and Minimum error tree. Generate a Detailed Scoring report for all three sets of data.
a. In terms of number of decision nodes, compare the size of the full tree to the size of the best pruned tree.
b. What is the root mean squared error (RMSE) of the best pruned tree on the validation data and on the test data?
c. What is the average error on the validation data and test data? What does this suggest?
d. By examining the best pruned tree, what are the critical variables in predicting the risk?
Partition the data into training (50 percent), validation (30 percent), and test (20 percent) sets. Predict the Risk of stroke using a regression tree. Use Risk as the output variable and all the other variables as input variables. In Step 2 of XLMiner's Regression Tree procedure, be sure to Normalize input data, to set the Maximum #splits for input variables to 74, to set the Minimum #records in a terminal node to 1, and specify Using Best prune tree as the scoring option. In Step 3 of XLMiner's Regression Tree procedure, set the maximum number of levels to 7. Generate the Full tree, Best pruned tree, and Minimum error tree. Generate a Detailed Scoring report for all three sets of data.
a. In terms of number of decision nodes, compare the size of the full tree to the size of the best pruned tree.
b. What is the root mean squared error (RMSE) of the best pruned tree on the validation data and on the test data?
c. What is the average error on the validation data and test data? What does this suggest?
d. By examining the best pruned tree, what are the critical variables in predicting the risk?
A bank wants to understand better the details of customers who are likely to default the loan. In order to analyze this, the data from a random sample of 200 customers are given below:

 In XLMiner's Partition with Oversampling procedure, partition the data so there is 50 percent successes (Loan default) in the training set and 40 percent of the validation data is taken away as test data. Fit a classification tree using Loan Default as the output variable and all the other variables as input variables. In Step 2 of XLMiner's Classification Tree procedure, be sure to Normalize input data, and set the Minimum #records in a terminal node to 1. In Step 3 of XLMiner's Classification Tree procedure, set the maximum number of levels to 7. Generate the Full tree, Best pruned tree, and Minimum error tree. Generate lift charts for both the validation data and test data.
a. Why is partitioning with oversampling advised in this case?
b. Interpret the set of rules implied by the best pruned tree that characterize loan defaulters.
c. For the default cutoff value of 0.5, what are the overall error rate, Class 1 error rate, and Class 0 error rate of the best pruned tree on the test data?
d. Examine the decile-wise lift chart for the best pruned tree on the test data. What is the first decile lift? Interpret this value.
In XLMiner's Partition with Oversampling procedure, partition the data so there is 50 percent successes (Loan default) in the training set and 40 percent of the validation data is taken away as test data. Fit a classification tree using Loan Default as the output variable and all the other variables as input variables. In Step 2 of XLMiner's Classification Tree procedure, be sure to Normalize input data, and set the Minimum #records in a terminal node to 1. In Step 3 of XLMiner's Classification Tree procedure, set the maximum number of levels to 7. Generate the Full tree, Best pruned tree, and Minimum error tree. Generate lift charts for both the validation data and test data.
a. Why is partitioning with oversampling advised in this case?
b. Interpret the set of rules implied by the best pruned tree that characterize loan defaulters.
c. For the default cutoff value of 0.5, what are the overall error rate, Class 1 error rate, and Class 0 error rate of the best pruned tree on the test data?
d. Examine the decile-wise lift chart for the best pruned tree on the test data. What is the first decile lift? Interpret this value.
One minus the overall error rate is often referred to as the _____ of the model.
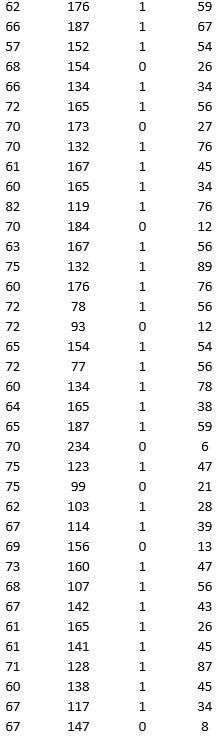
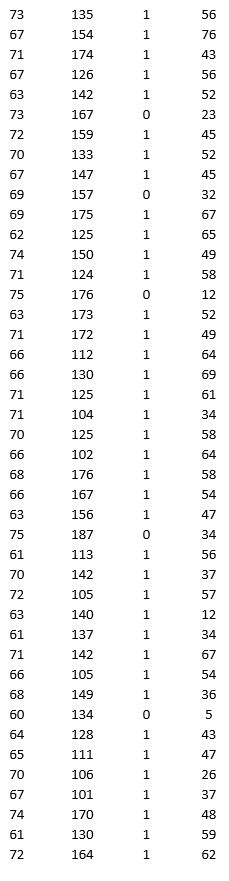
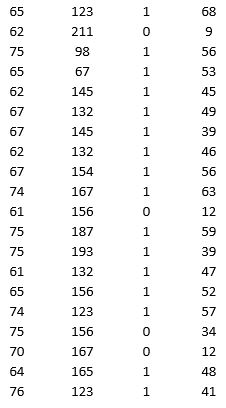
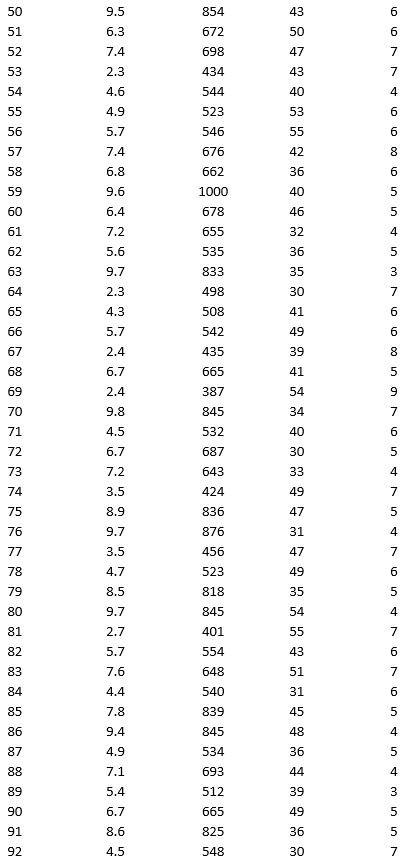
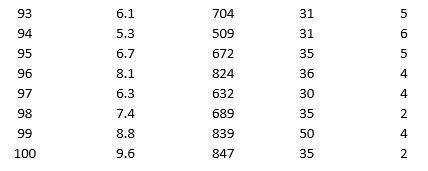
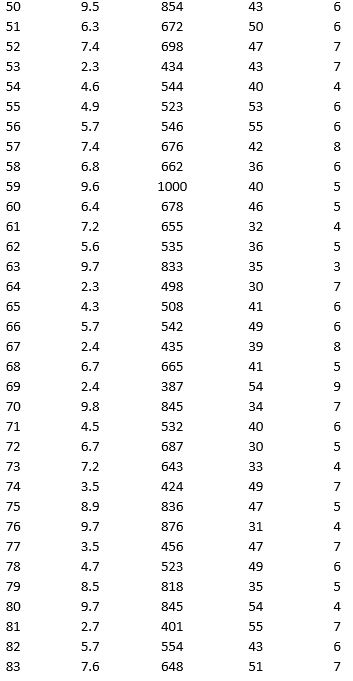
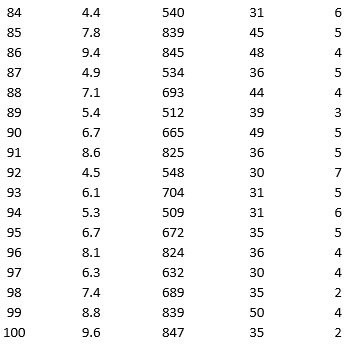
As part of the quarterly reviews, the manager of a retail store analyzes the quality of customer service based on the periodic customer satisfaction ratings (on a scale of 1 to 10 with 1 = Poor and 10 = Excellent). To understand the level of service quality, which includes the waiting times of the customers in the checkout section, he collected the following data on 100 customers who visited the store.

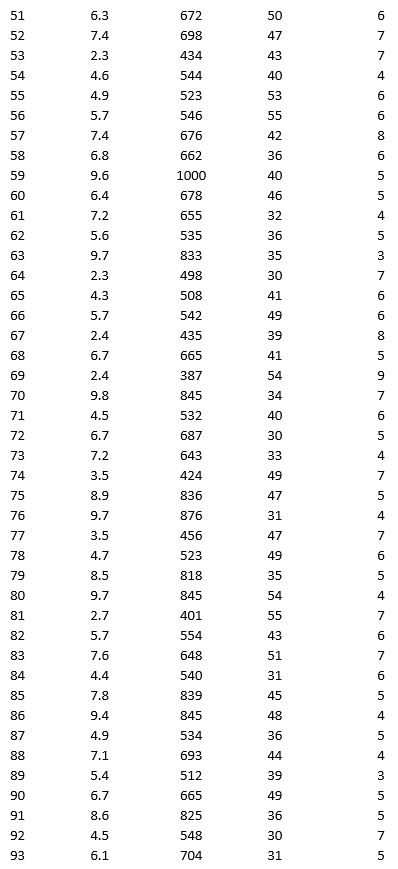
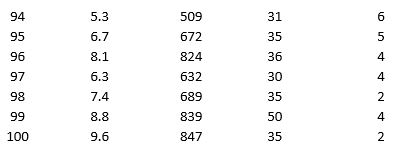 For the above data, apply k-means clustering using Wait time (min) as the variable with k = 3. Be sure to Normalize input data, and specify 50 iterations and 10 random starts in Step 2 of the XLMiner k-Means Clustering procedure. Then create one distinct data set for each of the three resulting clusters for waiting time.
a. For the observations composing the cluster which has the low waiting time, apply hierarchical clustering with Ward's method to form two clusters using Purchase Amount, Customer Age, and Customer Satisfaction Rating as variables. Be sure to Normalize input data in Step 2 of the XLMiner Hierarchical Clustering procedure. Using a PivotTable on the data in HC_Clusters, report the characteristics of each cluster.
b. For the observations composing the cluster which has the medium waiting time, apply hierarchical clustering with Ward's method to form three clusters using Purchase Amount, Customer Age, and Customer Satisfaction Rating as variables. Be sure to Normalize input data in Step 2 of the XLMiner Hierarchical Clustering procedure. Using a PivotTable on the data in HC_Clusters, report the characteristics of each cluster.
c. For the observations composing the cluster which has the high waiting time, apply hierarchical clustering with Ward's method to form two clusters using Purchase Amount, Customer Age, and Customer Satisfaction Rating as variables. Be sure to Normalize input data in Step 2 of the XLMiner Hierarchical Clustering procedure. Using a PivotTable on the data in HC_Clusters, report the characteristics of each cluster.
For the above data, apply k-means clustering using Wait time (min) as the variable with k = 3. Be sure to Normalize input data, and specify 50 iterations and 10 random starts in Step 2 of the XLMiner k-Means Clustering procedure. Then create one distinct data set for each of the three resulting clusters for waiting time.
a. For the observations composing the cluster which has the low waiting time, apply hierarchical clustering with Ward's method to form two clusters using Purchase Amount, Customer Age, and Customer Satisfaction Rating as variables. Be sure to Normalize input data in Step 2 of the XLMiner Hierarchical Clustering procedure. Using a PivotTable on the data in HC_Clusters, report the characteristics of each cluster.
b. For the observations composing the cluster which has the medium waiting time, apply hierarchical clustering with Ward's method to form three clusters using Purchase Amount, Customer Age, and Customer Satisfaction Rating as variables. Be sure to Normalize input data in Step 2 of the XLMiner Hierarchical Clustering procedure. Using a PivotTable on the data in HC_Clusters, report the characteristics of each cluster.
c. For the observations composing the cluster which has the high waiting time, apply hierarchical clustering with Ward's method to form two clusters using Purchase Amount, Customer Age, and Customer Satisfaction Rating as variables. Be sure to Normalize input data in Step 2 of the XLMiner Hierarchical Clustering procedure. Using a PivotTable on the data in HC_Clusters, report the characteristics of each cluster.
As part of the quarterly reviews, the manager of a retail store analyzes the quality of customer service based on the periodic customer satisfaction ratings (on a scale of 1 to 10 with 1 = Poor and 10 = Excellent). To understand the level of service quality, which includes the waiting times of the customers in the checkout section, he collected the following data on 100 customers who visited the store.

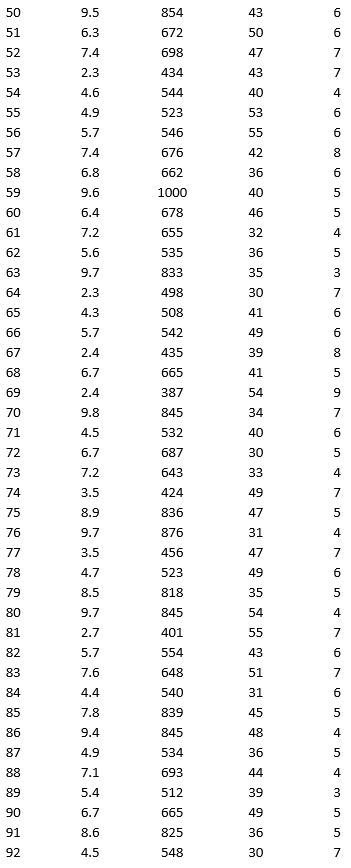
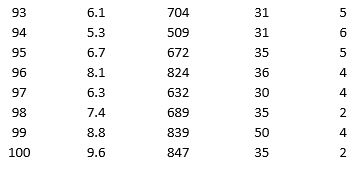 a. Apply hierarchical clustering with 5 clusters using Wait Time (min) and Customer Satisfaction Rating as variables. Be sure to Normalize input data in Step 2 of the XLMiner Hierarchical Clustering procedure, and specify single linkage as the clustering method. Analyze the resulting clusters by computing the cluster size. It may be helpful to use a PivotTable on the data in the HC_Clusters worksheet generated by XLMiner to compute descriptive measures of the Wait Time and Customer Satisfaction Rating variables in each cluster. You can also visualize the clusters by creating a scatter plot with Wait Time (min) as the x-variable and Customer Satisfaction Rating as the y-variable.
b. Repeat part a using average linkage as the clustering method. Compare the clusters to the previous method.
a. Apply hierarchical clustering with 5 clusters using Wait Time (min) and Customer Satisfaction Rating as variables. Be sure to Normalize input data in Step 2 of the XLMiner Hierarchical Clustering procedure, and specify single linkage as the clustering method. Analyze the resulting clusters by computing the cluster size. It may be helpful to use a PivotTable on the data in the HC_Clusters worksheet generated by XLMiner to compute descriptive measures of the Wait Time and Customer Satisfaction Rating variables in each cluster. You can also visualize the clusters by creating a scatter plot with Wait Time (min) as the x-variable and Customer Satisfaction Rating as the y-variable.
b. Repeat part a using average linkage as the clustering method. Compare the clusters to the previous method.
The lift ratio of an association rule with a confidence value of 0.43 and in which the consequent occurs in 6 out of 10 cases is:
As part of the quarterly reviews, the manager of a retail store analyzes the quality of customer service based on the periodic customer satisfaction ratings (on a scale of 1 to 10 with 1 = Poor and 10 = Excellent). To understand the level of service quality, which includes the waiting times of the customers in the checkout section, he collected the following data on 100 customers who visited the store.

 Apply k-means clustering with k = 5 using Wait Time (min), Purchase Amount ($), Customer Age, and Customer Satisfaction Rating as variables. Be sure to Normalize input data, and specify 50 iterations and 10 random starts in Step 2 of the XLMiner k-Means Clustering procedure. Analyze the resultant clusters. What is the smallest cluster? What is the least dense cluster (as measured by the average distance in the cluster)? What reasons do you see for low customer satisfaction ratings?
_____ refers to the scenario in which the analyst builds a model that does a great job of explaining the sample of data on which it is based but fails to accurately predict outside the sample data.
As part of the quarterly reviews, the manager of a retail store analyzes the quality of customer service based on the periodic customer satisfaction ratings (on a scale of 1 to 10 with 1 = Poor and 10 = Excellent). To understand the level of service quality, which includes the waiting times of the customers in the checkout section, he collected the following data on 100 customers who visited the store.

 Apply hierarchical clustering with 5 clusters using Wait Time (min), Purchase Amount ($), Customer Age, and Customer Satisfaction Rating as variables. Be sure to Normalize input data in Step 2 of the XLMiner Hierarchical Clustering procedure. Use Ward's method as the clustering method.
a. Use a PivotTable on the data in the HC_Clusters1 worksheet to compute the cluster centers for the five clusters in the hierarchical clustering.
b. Identify the cluster with the largest average waiting time. Using all the variables, how would you characterize this cluster?
c. Identify the smallest cluster.
d. By examining the dendrogram on the HC_Dendrogram worksheet (as well as the sequence of clustering stages in HC_Output1), what number of clusters seems to be the most natural fit based on the distance?
Apply hierarchical clustering with 5 clusters using Wait Time (min), Purchase Amount ($), Customer Age, and Customer Satisfaction Rating as variables. Be sure to Normalize input data in Step 2 of the XLMiner Hierarchical Clustering procedure. Use Ward's method as the clustering method.
a. Use a PivotTable on the data in the HC_Clusters1 worksheet to compute the cluster centers for the five clusters in the hierarchical clustering.
b. Identify the cluster with the largest average waiting time. Using all the variables, how would you characterize this cluster?
c. Identify the smallest cluster.
d. By examining the dendrogram on the HC_Dendrogram worksheet (as well as the sequence of clustering stages in HC_Output1), what number of clusters seems to be the most natural fit based on the distance?
A bank wants to understand better the details of customers who are likely to default the loan. In order to analyze this, the data from a random sample of 200 customers are given below:

 In XLMiner's Partition with Oversampling procedure, partition the data so there is 50 percent successes (Loan default) in the training set and 40 percent of the validation data is taken away as test data. Classify the data using k-nearest neighbors with up to k = 10. Use Loan default as the output variable and all the other variables as input variables. In Step 2 of XLMiner's k-nearest neighbors Classification procedure, be sure to Normalize input data and to Score on best k between 1 and specified value. Generate lift charts for both the validation data and test data.
a. For the cutoff probability value 0.5, what value of k minimizes the overall error rate on the validation data?
b. What is the overall error rate on the test data? Interpret this measure.
c. What are the Class 1 error rate and the Class 0 error rate on the test data?
d. Compute and interpret the sensitivity and specificity for the test data.
e. Examine the decile-wise lift chart on the test data. What is the first decile lift on the test data? Interpret this value.
In XLMiner's Partition with Oversampling procedure, partition the data so there is 50 percent successes (Loan default) in the training set and 40 percent of the validation data is taken away as test data. Classify the data using k-nearest neighbors with up to k = 10. Use Loan default as the output variable and all the other variables as input variables. In Step 2 of XLMiner's k-nearest neighbors Classification procedure, be sure to Normalize input data and to Score on best k between 1 and specified value. Generate lift charts for both the validation data and test data.
a. For the cutoff probability value 0.5, what value of k minimizes the overall error rate on the validation data?
b. What is the overall error rate on the test data? Interpret this measure.
c. What are the Class 1 error rate and the Class 0 error rate on the test data?
d. Compute and interpret the sensitivity and specificity for the test data.
e. Examine the decile-wise lift chart on the test data. What is the first decile lift on the test data? Interpret this value.
Filters
- Essay(0)
- Multiple Choice(0)
- Short Answer(0)
- True False(0)
- Matching(0)