Exam 11: Monte Carlo Simulation
Exam 1: Introduction30 Questions
Exam 2: Descriptive Statistics60 Questions
Exam 3: Data Visualization61 Questions
Exam 4: Linear Regression60 Questions
Exam 5: Time Series Analysis and Forecasting58 Questions
Exam 6: Data Mining60 Questions
Exam 7: Spreadsheet Models60 Questions
Exam 8: Linear Optimization Models60 Questions
Exam 9: Integer Linear Optimization Models60 Questions
Exam 10: Nonlinear Optimization Models60 Questions
Exam 11: Monte Carlo Simulation59 Questions
Exam 12: Decision Analysis60 Questions
Select questions type
A specialty hedge fund is considering the purchase of a Jackson Pollock painting. It estimates the value of the painting to be $185 million. In an auction, both the number of competing bids and the amount of the competing bids is uncertain. The hedge fund has maintained a file summarizing 10 recent art auctions that it believes are similar to the upcoming auction. It is considering a bid of $163 million and would like to evaluate its chances of winning the upcoming auction with this bid.
 a. Construct a spreadsheet simulation model for this auction. Use a discrete uniform distribution between the minimum and maximum number of bidders in the 10 observed auctions to model the number of bidders in the Jackson Pollock auction. Fit a realistic distribution to the bid data to generate values of competing bid amounts. Use ASP to apply simulation optimization to determine the hedge fund's bid amount that maximizes the expected return = P(winning auction)*(185 - bid amount). Hint: Placing reasonable bounds on the highest and lowest possible bid amount will greatly assist the optimization algorithm.
b. What is the probability that the hedge fund wins the auction if it bids the amount that maximizes its expected return?
a. Construct a spreadsheet simulation model for this auction. Use a discrete uniform distribution between the minimum and maximum number of bidders in the 10 observed auctions to model the number of bidders in the Jackson Pollock auction. Fit a realistic distribution to the bid data to generate values of competing bid amounts. Use ASP to apply simulation optimization to determine the hedge fund's bid amount that maximizes the expected return = P(winning auction)*(185 - bid amount). Hint: Placing reasonable bounds on the highest and lowest possible bid amount will greatly assist the optimization algorithm.
b. What is the probability that the hedge fund wins the auction if it bids the amount that maximizes its expected return?
Free
(Essay)
4.8/5  (31)
(31)
Correct Answer: Verified
a. Refer to the screenshot below for the Spreadsheet Simulation Model.
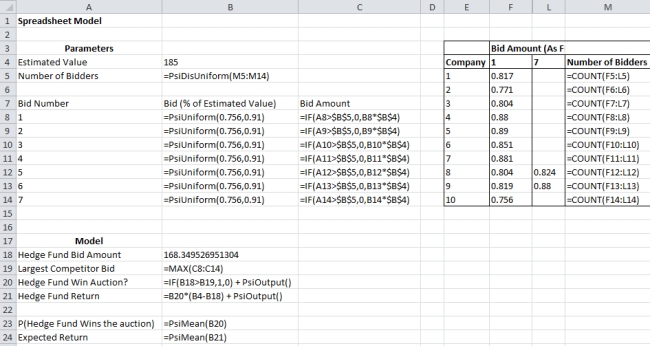
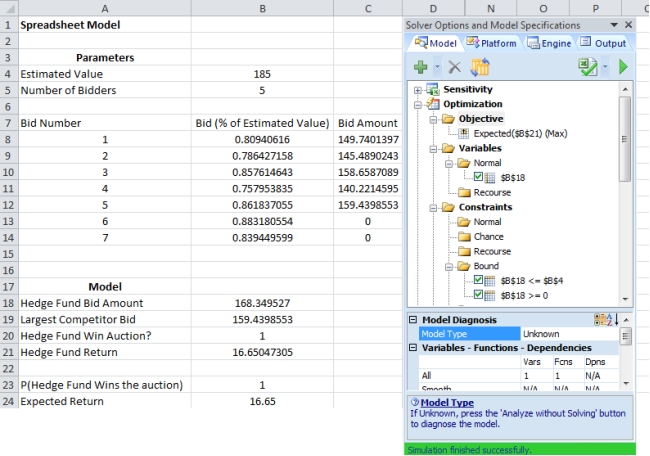
A bid amount of about $168.35 million maximizes the expected return on the auction to a value of approximately $16.65 million.
b. A bid amount of $168.35 million has a nearly a 100% chance of winning the auction. This is because the maximum competitor bid is .91*185 = $168.35 million.
The Excel function _____ generates integer values between lower and upper bounds.
Free
(Multiple Choice)
4.8/5 (34)
Correct Answer:Verified
B
The weekly demand for an item in a retail store follows a uniform distribution over the range 70 to 83. What would be the weekly demand if its corresponding computer-generated value is 0.5?
Free
(Multiple Choice)
4.8/5 (33)
Correct Answer:Verified
C
The Excel add-in _____ is used to design a spreadsheet simulation model.
(Multiple Choice)
4.8/5 (34)
A _____ analysis involves considering alternative values for the random variables and computing the resulting value for the output.
(Multiple Choice)
4.9/5 (37)
A tourist bus can accommodate 80 people and currently books up to 80 reservations. Past data shows that the tourist bus always accommodates all 80 reservations but that, on average, two people do not show up. To capture additional profit, the travel agent is considering an overbooking strategy in which he would accept 82 reservations even though the tourist bus can accommodate only 80 people. The travel agent believes that he will be able to always book all 82 reservations. The probability distribution for the number of people showing up when 82 reservations are accepted is estimated as follows:
 The travel agent receives a marginal profit of $110 for each passenger who books a reservation (regardless whether they show up). The travel agent will also incur a cost for any passenger denied seating on the bus. This cost covers added expenses of rescheduling the passenger as well as loss of goodwill, estimated to be $160 per passenger. Develop a spreadsheet simulation model for this overbooking system. Simulate the number of passengers showing up. a. What is the average net profit for each tourist bus with the overbooking strategy?
b. What is the probability that the net profit with the overbooking strategy will be less than the net profit without overbooking (80*$110 = $8,800)?
c. Explain how your simulation model could be used to evaluate other overbooking levels such as 81, 83, and 84 and for recommending a best overbooking strategy.
The travel agent receives a marginal profit of $110 for each passenger who books a reservation (regardless whether they show up). The travel agent will also incur a cost for any passenger denied seating on the bus. This cost covers added expenses of rescheduling the passenger as well as loss of goodwill, estimated to be $160 per passenger. Develop a spreadsheet simulation model for this overbooking system. Simulate the number of passengers showing up. a. What is the average net profit for each tourist bus with the overbooking strategy?
b. What is the probability that the net profit with the overbooking strategy will be less than the net profit without overbooking (80*$110 = $8,800)?
c. Explain how your simulation model could be used to evaluate other overbooking levels such as 81, 83, and 84 and for recommending a best overbooking strategy.
(Essay)
4.8/5 (32)
The _____ function is used to generate a pseudorandom number in Excel.
(Multiple Choice)
4.9/5 (40)
In a simulation process, the error of the estimates of the output can be reduced by
(Multiple Choice)
4.7/5 (27)
The choice of the probability distribution for a random variable can be guided by
(Multiple Choice)
4.9/5 (32)
The quality of a device should be examined in the inspection department sequentially in three steps before it is sent to packaging department. The probability distributions for the time required to complete each of the activities are as follows:
 a. Construct a spreadsheet simulation model to estimate the average time spent in inspection department and the standard deviation of the time spent in inspection department.
b. What is the estimated probability that the inspection will be completed in 32 minutes or less?
a. Construct a spreadsheet simulation model to estimate the average time spent in inspection department and the standard deviation of the time spent in inspection department.
b. What is the estimated probability that the inspection will be completed in 32 minutes or less?
(Essay)
4.9/5 (31)
For a given mean and standard deviation, the _____ function in Excel is used to generate a value for the random variable characterized by a normal distribution.
(Multiple Choice)
4.9/5 (27)
The manager of a company decides to arrange a party for being promoted and has invited 50 guests for dinner. The following table contains information on the number of RSVP'ed guests. He assumes that 12 people will not turn up. He also estimates that 13 guests planning to come solo has a 65 percent chance of attending alone, a 30 percent chance of not attending, and a 5 percent chance of bringing a companion. For each of the 20 guests who plan to bring a companion, there is a 75 percent chance that she or he will attend with a companion, a 10 percent chance of attending solo, and a 15 percent chance of not attending at all. For the 5 people who have not responded, the wedding planner assumes that there is an 85 percent chance that each will not attend, a 10 percent chance they will attend alone, and a 5 percent chance they will attend with a companion.
 a. Assist the manager by constructing a spreadsheet simulation model to determine the expected number of guests who will attend the party.
b. Use the Monte Carlo simulation model to determine X, the minimum number of guests for whom the dinner needs to be ordered, so that there is at least a 95 percent chance that the actual attendance is less than or equal to X. What is the best estimate for the value of X?
a. Assist the manager by constructing a spreadsheet simulation model to determine the expected number of guests who will attend the party.
b. Use the Monte Carlo simulation model to determine X, the minimum number of guests for whom the dinner needs to be ordered, so that there is at least a 95 percent chance that the actual attendance is less than or equal to X. What is the best estimate for the value of X?
(Essay)
4.9/5 (31)
In a _____, a random variable can take any value in a specified range.
(Multiple Choice)
4.8/5 (27)
The random variables corresponding to the interarrival times of customers and the service times of customers are commonly described by a(n) _____ distribution.
(Multiple Choice)
4.9/5 (32)
A set of values for the random variables is called a(n) _____.
(Multiple Choice)
4.7/5 (40)
A store is offering a discount on 800 pairs of basketball shoes. The amount of the discount varies and is not revealed to the customer until paying for the shoes. The distribution of discounts is given in the below table:
 Use the negative binomial distribution to approximate the average number of pairs of shoes that a customer has to buy before purchasing two pair with a discount of at least 50%.
(Essay)
4.7/5 (44)
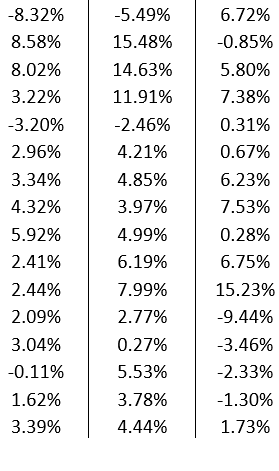
A branded store has outlets around the world that generates profit in the British pound, the New Zealand kiwi, and the Japanese yen. At the end of each quarter, the store converts the revenue from these three international outlets back into U.S. dollars, exposing itself to exchange rate risk. The current exchange rates are US$1.56 per £1, US$0.85 per NZD$1, and US$0.02 per ¥1. The management of the store wants to construct a simulation model to assess its vulnerability to uncertain exchange rate fluctuations. The quarterly profits earned in British pounds, New Zealand kiwis, and Japanese yen are £150,000, NZD$200,000, and ¥9,000,000, respectively. The data is given below.
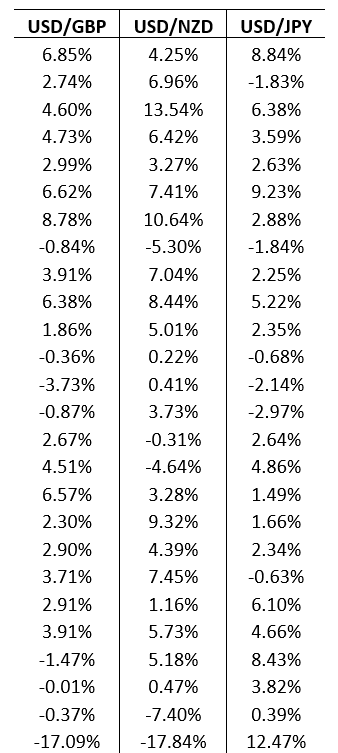
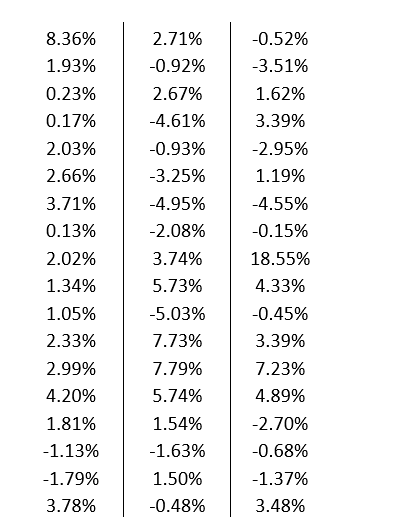 a. If exchange rates stay at their current values, what is the total quarterly profit in U.S. dollars?
b. Model the uncertainty in the quarterly changes of the exchange rates between U.S. dollars and British pounds, New Zealand kiwis, and Japanese yen using a SLURP. Use your simulation model to estimate the average total quarterly profit in U.S. dollars. What is the probability that the total quarterly profit will be lower than the answer in part a?
a. If exchange rates stay at their current values, what is the total quarterly profit in U.S. dollars?
b. Model the uncertainty in the quarterly changes of the exchange rates between U.S. dollars and British pounds, New Zealand kiwis, and Japanese yen using a SLURP. Use your simulation model to estimate the average total quarterly profit in U.S. dollars. What is the probability that the total quarterly profit will be lower than the answer in part a?
(Essay)
4.8/5 (31)
Filters
- Essay(0)
- Multiple Choice(0)
- Short Answer(0)
- True False(0)
- Matching(0)