Exam 7: Spreadsheet Models
Exam 1: Introduction30 Questions
Exam 2: Descriptive Statistics60 Questions
Exam 3: Data Visualization61 Questions
Exam 4: Linear Regression60 Questions
Exam 5: Time Series Analysis and Forecasting58 Questions
Exam 6: Data Mining60 Questions
Exam 7: Spreadsheet Models60 Questions
Exam 8: Linear Optimization Models60 Questions
Exam 9: Integer Linear Optimization Models60 Questions
Exam 10: Nonlinear Optimization Models60 Questions
Exam 11: Monte Carlo Simulation59 Questions
Exam 12: Decision Analysis60 Questions
Select questions type
Anna operates a consignment shop where she sells cloths for women and children. The average consignments sold per month is 1000. The average material cost and the selling price of each consignment is $8 and $20, respectively.
The monthly fixed cost to run this business is given below:
Rental cost: $750
Utilities: $150
Advertising: $35
Insurance: $100
Labor cost: $4000
Use a two-way data table to show profit changes as a function of different number of consignments sold per month and different material costs. Vary the number of consignments from 400 to 1200 in increments of 100. The eight different material costs are $5.45, $6.23, $6.95, $7.54, $8.23, $8.88, $9, and $9.45.
(Essay)
4.9/5  (31)
(31)
The _____ button provides an automatic means of checking for mathematical errors within formulas of a worksheet.
(Multiple Choice)
4.8/5 (37)
Within a given range of cells, the number of times a particular condition is satisfied is computed by using the _____ function.
(Multiple Choice)
4.8/5 (38)
John would like to establish a retirement plan that returns an amount of $100,000 after a period of 20 years from now. Build a spreadsheet model to calculate the amount John must contribute at the end of each year towards his retirement fund, assuming an annual interest rate of 6%.
Use the Excel function
=PMT(rate, nper, pv, fv, type)
The arguments of this function are
rate = the interest rate for the loan
nper = the total number of payments
pv = present value (the amount borrowed which is 0 in this case)
fv = future value (in the formula, indicate this value as negative as the future value command assumes a stream of payments not deposits)
type = payment type (0 = end of period, 1 = beginning of the period)
Also, construct a one-way table with interest rate as the column variable and the amount contributed at the end of each year as the output. Vary the interest rate from 4% to 7% in increments of 0.5%.
(Essay)
4.8/5 (29)
The impact of two inputs on the output of interest is given by a _____.
(Multiple Choice)
4.8/5 (35)
Arrows pointing from the selected cell to cells that depend on the selected cell are generated by using the _____ button of the Formula Auditing group.
(Multiple Choice)
4.7/5 (36)
The _____ function pairs each element of the first array with its counterpart in the second array, multiplies the elements of the pairs together, and adds the results.
(Multiple Choice)
4.8/5 (42)
The average cost/unit for the production of a particular component at a manufacturing plant varies with the number of units produced in each batch. The data are given below.

 Suppose the selling price of each unit is $35.
Use a two-way data table to show how the profit changes as a function of demand and the selling price of the product. Vary the demand from 20 units to 80 units in increments of 10 units and selling price from $30 to $40 in increments of $2.
Suppose the selling price of each unit is $35.
Use a two-way data table to show how the profit changes as a function of demand and the selling price of the product. Vary the demand from 20 units to 80 units in increments of 10 units and selling price from $30 to $40 in increments of $2.
(Essay)
4.8/5 (35)
Starsystems is a small information systems company that employs 50 workers. The employee details for a particular month are given below:

 a. The administrative manager of the company wanted to know the total number of employees who were on leave for 4 days and 5 days in this month. Use COUNTIF function to determine this.
b. Now, the manger wanted the details of employees, Ava, Julia, and Alanis who are working in the company. Use VLOOKUP function to get these employees details.
a. The administrative manager of the company wanted to know the total number of employees who were on leave for 4 days and 5 days in this month. Use COUNTIF function to determine this.
b. Now, the manger wanted the details of employees, Ava, Julia, and Alanis who are working in the company. Use VLOOKUP function to get these employees details.
(Essay)
4.9/5 (42)
In _____ decision making companies have to decide whether they should manufacture a product or outsource its production to another firm.
(Multiple Choice)
5.0/5 (38)
Suppose a company supplies four of its products A, B, C, and D, to five different regions. The management wanted to know the total number of all products supplied to each region and the total units of each product supplied. The data collected over a period of month are given below?Provide a data file?
ansrsource: The required data is provided below the question and we have been following this for all the completed chapters till date.
:
Provide a data file?
ansrsource: The required data is provided below the question and we have been following this for all the completed chapters till date.
 There are several ways to get this information from the given data set. One way is to use the SUMIF function. The SUMIF function extends the SUM function by allowing the user to add the values of cells meeting a logical condition. The general form of the function is
=SUMIF(test range, condition, range to be summed)
Using the SUMIF function, find the total volume by each region and total volume by each product.
There are several ways to get this information from the given data set. One way is to use the SUMIF function. The SUMIF function extends the SUM function by allowing the user to add the values of cells meeting a logical condition. The general form of the function is
=SUMIF(test range, condition, range to be summed)
Using the SUMIF function, find the total volume by each region and total volume by each product.
(Essay)
4.8/5 (33)
The _____ function is used for the conditional computation of expressions in Excel.
(Multiple Choice)
4.8/5 (43)
The modularity approach of building the influence diagram for a portion of the problem first and then expanding until the total problem is conceptually modeled:
(Multiple Choice)
4.9/5 (42)
. Reference - 7.1Use the influence diagram given below to answer questions
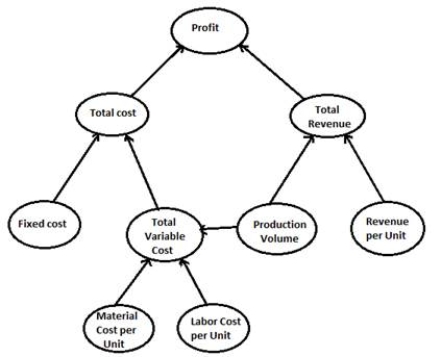 -Which of the following would be a likely mathematical expression for Total Revenue?
(Multiple Choice)
4.8/5 (29)
The modeling process begins with the framing of the _____ that shows the relationships between the various parts of the problem being modeled.
(Multiple Choice)
4.8/5 (34)
A company asked one of their analysis team to analyze and create models that help decide whether they should manufacture a particular product or outsource its production. The different components are given below:
Fixed Cost, FC = $25,000
Material Cost per Unit, MC = $2.15
Labor Cost per Unit, LC = $2.00
Outsourcing Cost per Unit, O = $4.50
Note that per-unit material and labor cost together make up the variable cost per unit. a. Using the spreadsheet model, construct a one-way data table with production volume as the column input and savings due to outsourcing as the output. Breakeven occurs when profit goes from a positive to a negative value, that is, breakeven is when total outsource cost = total cost, yielding savings due to outsourcing equal to zero. Vary production volume from 0 to 100,000 in increments of 10,000. In which interval of production volume does breakeven occur?
b. Use Goal Seek to find the exact breakeven point. Assign Set cell: equal to the location of savings due to outsourcing, To value: = 0, and By changing cell: equal to the location of the production volume in your model.
(Essay)
4.8/5 (36)
Which of the following approaches is a good way to proceed with the influence diagram building for a problem?
(Multiple Choice)
4.9/5 (32)
Filters
- Essay(0)
- Multiple Choice(0)
- Short Answer(0)
- True False(0)
- Matching(0)