Exam 21: Inference for Regression
Exam 1: Picturing Distributions With Graphs38 Questions
Exam 2: Describing Quantitative Distributions With Numbers42 Questions
Exam 3: Scatterplots and Correlation42 Questions
Exam 4: Regression41 Questions
Exam 5: Two-Way Tables35 Questions
Exam 6: Samples and Observational Studies34 Questions
Exam 7: Designing Experiments40 Questions
Exam 8: Essential Probability Rules58 Questions
Exam 9: Independence and Conditional Probabilities38 Questions
Exam 10: The Normal Distributions43 Questions
Exam 11: Discrete Probability Distributions43 Questions
Exam 12: Sampling Distributions48 Questions
Exam 13: Introduction to Inference48 Questions
Exam 14: Exercises44 Questions
Exam 15: Inference About a Population Mean44 Questions
Exam 16: Comparing Two Means40 Questions
Exam 17: Inference About a Population Proportion39 Questions
Exam 18: Comparing Two Proportions47 Questions
Exam 19: The Chi-Square Test for Goodness of Fit40 Questions
Exam 20: The Chi-Square Test for Two-Way Tables42 Questions
Exam 21: Inference for Regression45 Questions
Exam 22: One-Way Analysis of Variance: Comparing Several Means40 Questions
Exam 23: More About Analysis of Variance: Follow-Up Tests and Two-Way Anova39 Questions
Exam 24: Nonparametric Tests41 Questions
Exam 25: Multiple and Logistic Regression28 Questions
Select questions type
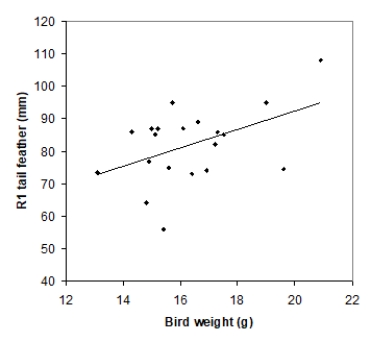
Tail-feather length in birds is sometimes a sexually dimorphic trait; that is, the trait differs substantially for males and for females of the same species. Researchers studied the relationship between tail-feather length (measuring the R1 central tail feather) and weight in a sample of 20 male long-tailed finches raised in an aviary. The data are displayed in the scatterplot below, followed with software output about the least-squares regression model of feather length as a function of weight.

Coefficients Standard Error Intercept 35.7379 21.0523 Bird-weight 2.8299 1.2811 R Square 0.2133 Standard Error \ 10.5270\ We want to test the hypotheses H0: β = 0 versus Ha: β > 0, where β is the true value of the population slope. What is the P-value for this test?
Coefficients Standard Error Intercept 35.7379 21.0523 Bird-weight 2.8299 1.2811 R Square 0.2133 Standard Error \ 10.5270\ We want to test the hypotheses H0: β = 0 versus Ha: β > 0, where β is the true value of the population slope. What is the P-value for this test?
(Multiple Choice)
4.9/5  (34)
(34)
A researcher from the crop and soil sciences department at your local university is interested in the relationship between the amount of phosphorus and nitrogen found in the ground. She takes a random sample of sites in the Commonwealth of Virginia and fits a linear regression model to the data. Based on this model, she obtains the following prediction results:
Nitrogen Level Predicted Phosphorus Level Std Error Predict CI PI 20 15 1.25 (12,18) (10,20) What is a 95% confidence interval for the mean amount of phosphorus when the nitrogen level is 20?
(Multiple Choice)
4.8/5 (34)
A random sample of 79 patients from a walk-in clinic records the low- and high-density cholesterol levels of the patients, labeled LDL and HDL, respectively. LDL is often referred to as "bad" cholesterol, while HDL is often referred to as "good" cholesterol. A researcher is interested in fitting the following linear regression curve to LDL and HDL levels:
LDLi = α+ β× HDLi + Ɛi
Where the deviations Ɛi are assumed to be independent and Normally distributed with mean 0 and standard deviation σ. This model was fit to the data using the method of least squares. The following results were obtained from statistical software:
Variable Estimate Standard Error of Estimate Constant -25 3.000 HDL 0.75 0.025 r2 = 0.810, s = 50.
Suppose the researchers test the following hypotheses:
H0: β1 = 0, Ha: β1 > 0
What is the P-value of the test?
(Multiple Choice)
4.8/5 (23)
Tail-feather length in birds is sometimes a sexually dimorphic trait; that is, the trait differs substantially for males and for females of the same species. Researchers studied the relationship between tail-feather length (measuring the R1 central tail feather) and weight in a sample of 20 male long-tailed finches raised in an aviary. The data are displayed in the scatterplot below, followed with software output about the least-squares regression model of feather length as a function of weight.
Coefficients Standard Error Intercept 35.7379 21.0523 Bird-weight 2.8299 1.2811 R Square 0.2133 Standard Error \ 10.5270\ We want to test the hypotheses H0: β = 0 versus Ha: β > 0, where β is the true value of the population slope. What is the value of the t statistic for this test?
Coefficients Standard Error Intercept 35.7379 21.0523 Bird-weight 2.8299 1.2811 R Square 0.2133 Standard Error \ 10.5270\ We want to test the hypotheses H0: β = 0 versus Ha: β > 0, where β is the true value of the population slope. What is the value of the t statistic for this test?
(Multiple Choice)
4.9/5 (36)
Data on the water quality in the eastern United States were obtained by a researcher who wanted to ascertain whether the amount of particulates in water (ppm) could be used to accurately predict the water quality score. Suppose we use the following simple linear regression model:
Qualityi = α+ β× particulatesi + Ɛi
Where the deviations Ɛi are assumed to be independent and Normally distributed with mean 0 and standard deviation σ. This model was fit to the data using the method of least squares. The following results were obtained from statistical software based on a sample of size 61:
Variable Estimate Standard Error of Estimate Constant 6.214 1.003 Particulates -0.009 0.020 r2 = 0.005, s = 0.7896.
What is the correlation between the amount of particulates and water quality?
(Multiple Choice)
4.9/5 (44)
Filters
- Essay(0)
- Multiple Choice(0)
- Short Answer(0)
- True False(0)
- Matching(0)