Exam 1: Introduction to Physiology
Exam 1: Introduction to Physiology69 Questions
Exam 2: Molecular Interactions149 Questions
Exam 3: Compartmentation: Cells and Tissues160 Questions
Exam 4: Energy and Cellular Metabolism147 Questions
Exam 5: Membrane Dynamics144 Questions
Exam 6: Communication, Integration, and Homeostasis82 Questions
Exam 7: Introduction to the Endocrine System76 Questions
Exam 8: Neurons: Cellular and Network Properties229 Questions
Exam 9: The Central Nervous System107 Questions
Exam 10: Sensory Physiology175 Questions
Exam 11: Efferent Division: Autonomic and Somatic Motor Control78 Questions
Exam 12: Muscles106 Questions
Exam 13: Integrative Physiology I: Control of Body Movement76 Questions
Exam 14: Cardiovascular Physiology191 Questions
Exam 15: Blood Flow and the Control of Blood Pressure125 Questions
Exam 16: Blood114 Questions
Exam 17: Mechanics of Breathing118 Questions
Exam 18: Gas Exchange and Transport87 Questions
Exam 19: The Kidneys76 Questions
Exam 20: Integrative Physiology II: Fluid and Electrolyte Balance83 Questions
Exam 21: The Digestive System140 Questions
Exam 22: Metabolism and Energy Balance133 Questions
Exam 23: Endocrine Control of Growth and Metabolism100 Questions
Exam 24: The Immune System120 Questions
Exam 25: Integrative Physiology III: Exercise62 Questions
Exam 26: Reproduction and Development124 Questions
Select questions type
Mass balance involves determining the total amount of a substance in the body.We can determine the rate of production (i.e.Mass Flow)of this substance by which of the following formulas?
Free
(Multiple Choice)
4.8/5  (31)
(31)
Correct Answer: Verified
E
You want to display data on the finish times of the 10 fastest race horses in a single race at the Kentucky Derby.
Which type of graph would be best to display this information?
Free
(Multiple Choice)
4.8/5 (32)
Correct Answer:Verified
A
Because anatomy and physiology have different definitions, they are usually considered separately in studies of the body.
Free
(True/False)
4.9/5 (32)
Correct Answer:Verified
False
High cholesterol levels have been shown to be a contributing factor to heart disease and death due to cardiovascular disease for many decades.In the 1970s, scientists used this information to develop a hypothesis that giving a medicine to reduce blood cholesterol levels could reduce the chances of developing cardiovascular disease or dying from cardiovascular disease.They tested a group of people living in a town called Framingham, Massachusetts.This study became known as the Framingham Study, and it is very well known because it did not support the hypothesis that giving cholesterol-lowering medications would reduce the risk of developing or dying from cardiovascular disease.Does this mean that high cholesterol is not a risk factor for heart disease? What does this demonstrate about the scientific process, especially as it pertains to human studies? You can find a copy of the study online and read it, if necessary.
(Essay)
4.9/5 (29)
There are 10 cloned horses, born on the same day, with identical chromosomes.They are each subjected to the same physical training regimen, but given daily injections of different concentrations of a particular vitamin.They all run the same race.You set up a graph to explore a relationship between race finish time and vitamin dose.
Which type of graph is best to explore a relationship between race finish time and vitamin dose?
(Multiple Choice)
4.8/5 (36)
Which of the following systems does NOT exchange material with the internal and external environments?
(Multiple Choice)
4.8/5 (37)
Use the following terms to develop a concept map:
brain, sensory neuron, an eye, foot, soccer ball, motor neuron
(Essay)
4.7/5 (38)
A horse runs 10 races, each a mile long, during a 6-month period, and you are interested in determining if the horse's race time changes with experience.You set up a graph to display the race finish times of this horse.
What would the labels be for the graph axes?
(Essay)
4.7/5 (45)
Why is it necessary to space grid marks on a graph proportionally to the quantity measured (example: each square represents one centimeter)?
(Essay)
4.9/5 (35)
Write a teleological explanation for why heart rate increases during exercise.Now write a mechanistic explanation for the same phenomenon.
(Essay)
4.9/5 (33)
You are designing a study to assess the effects of a new treatment for hypertension.What ethical considerations would you employ when monitoring your progress?
(Essay)
4.9/5 (30)
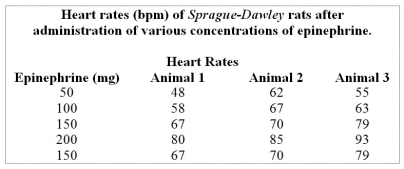
Table 1.1
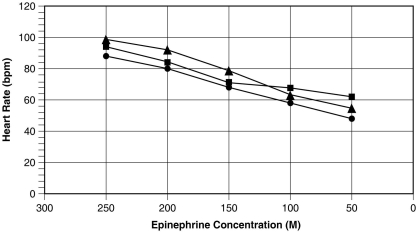 Figure 1.1
Use the table and graph below to answer the following questions.
Figure 1.1
Use the table and graph below to answer the following questions.
 -Summarize the data shown in Figure 1.2.
(Essay)
4.8/5 (43)
A technique used to resolve contradictory results in scientific studies is
(Multiple Choice)
4.9/5 (29)
Table 1.1
Figure 1.1
Use the table and graph below to answer the following questions.
-Referring to Figure 1.2, at approximately what age do men begin to show higher systolic blood pressures than women? At what age does this trend reverse?
(Essay)
4.8/5 (30)
You conduct an experiment on twenty 18-year-old male subjects to see how various intensities of exercise influence heart rate.Which of the following is/are considered an independent variable?
(Multiple Choice)
4.7/5 (42)
Following is a table of data collected from one section of an 8 a.m.physiology lab.There were 20 students present, 10 men and 10 women.Information collected from the students included their height, weight, age, gender, and resting pulse rate.In addition, the students were surveyed to see if they smoked cigarettes, considered themselves "regular exercisers," if they had consumed caffeine the morning of the lab, and if they had eaten breakfast that day.A "y" or "n" (yes or no) was recorded to indicate their answers.Each student did "jumping jacks" for 5 minutes and recorded the time required to regain their resting heart rate, which is listed on the table as "recovery time." Finally, each student participated in an exercise designed to measure their reaction time (in milliseconds) in catching an object dropped by a lab partner according to specified criteria.Use this table to answer the following questions.Ignore statistical problems caused by small sample size, and so on.
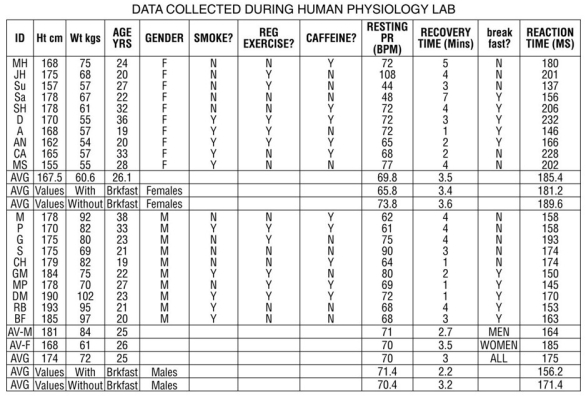 Table 1.3
 Figure 1.3
For these questions, the data were separated and analyzed by gender.
-Refer to Table 1.3.
A.Write a hypothesis regarding the effects of breakfast consumption on reaction time.
B.What is the dependent variable? What is the independent variable?
Figure 1.3
For these questions, the data were separated and analyzed by gender.
-Refer to Table 1.3.
A.Write a hypothesis regarding the effects of breakfast consumption on reaction time.
B.What is the dependent variable? What is the independent variable?
(Essay)
5.0/5 (42)
The vasodilation of blood vessels surrounding muscles due to the production of carbon dioxide during exercise is an example of which of the following?
(Multiple Choice)
4.8/5 (32)
Filters
- Essay(0)
- Multiple Choice(0)
- Short Answer(0)
- True False(0)
- Matching(0)