Exam 1: Introduction to Physiology
Exam 1: Introduction to Physiology69 Questions
Exam 2: Molecular Interactions149 Questions
Exam 3: Compartmentation: Cells and Tissues160 Questions
Exam 4: Energy and Cellular Metabolism147 Questions
Exam 5: Membrane Dynamics144 Questions
Exam 6: Communication, Integration, and Homeostasis82 Questions
Exam 7: Introduction to the Endocrine System76 Questions
Exam 8: Neurons: Cellular and Network Properties229 Questions
Exam 9: The Central Nervous System107 Questions
Exam 10: Sensory Physiology175 Questions
Exam 11: Efferent Division: Autonomic and Somatic Motor Control78 Questions
Exam 12: Muscles106 Questions
Exam 13: Integrative Physiology I: Control of Body Movement76 Questions
Exam 14: Cardiovascular Physiology191 Questions
Exam 15: Blood Flow and the Control of Blood Pressure125 Questions
Exam 16: Blood114 Questions
Exam 17: Mechanics of Breathing118 Questions
Exam 18: Gas Exchange and Transport87 Questions
Exam 19: The Kidneys76 Questions
Exam 20: Integrative Physiology II: Fluid and Electrolyte Balance83 Questions
Exam 21: The Digestive System140 Questions
Exam 22: Metabolism and Energy Balance133 Questions
Exam 23: Endocrine Control of Growth and Metabolism100 Questions
Exam 24: The Immune System120 Questions
Exam 25: Integrative Physiology III: Exercise62 Questions
Exam 26: Reproduction and Development124 Questions
Select questions type
Following is a table of data collected from one section of an 8 a.m.physiology lab.There were 20 students present, 10 men and 10 women.Information collected from the students included their height, weight, age, gender, and resting pulse rate.In addition, the students were surveyed to see if they smoked cigarettes, considered themselves "regular exercisers," if they had consumed caffeine the morning of the lab, and if they had eaten breakfast that day.A "y" or "n" (yes or no) was recorded to indicate their answers.Each student did "jumping jacks" for 5 minutes and recorded the time required to regain their resting heart rate, which is listed on the table as "recovery time." Finally, each student participated in an exercise designed to measure their reaction time (in milliseconds) in catching an object dropped by a lab partner according to specified criteria.Use this table to answer the following questions.Ignore statistical problems caused by small sample size, and so on.
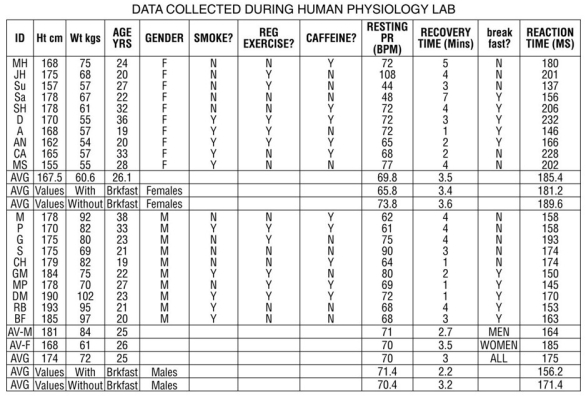 Table 1.3
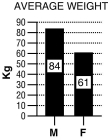 Figure 1.3
For these questions, the data were separated and analyzed by gender.
-Refer to Table 1.3 and Figure 1.3 (bar graph).
A.Write a hypothesis regarding gender and weight.
B.What is the dependent variable? What is the independent variable?
C.Based on the data in the graph above, what is your conclusion?
D.Why is a bar graph a good choice for presentation of these data? Would another type of chart be as effective?
Figure 1.3
For these questions, the data were separated and analyzed by gender.
-Refer to Table 1.3 and Figure 1.3 (bar graph).
A.Write a hypothesis regarding gender and weight.
B.What is the dependent variable? What is the independent variable?
C.Based on the data in the graph above, what is your conclusion?
D.Why is a bar graph a good choice for presentation of these data? Would another type of chart be as effective?
(Essay)
4.9/5  (34)
(34)
Following is a table of data collected from one section of an 8 a.m.physiology lab.There were 20 students present, 10 men and 10 women.Information collected from the students included their height, weight, age, gender, and resting pulse rate.In addition, the students were surveyed to see if they smoked cigarettes, considered themselves "regular exercisers," if they had consumed caffeine the morning of the lab, and if they had eaten breakfast that day.A "y" or "n" (yes or no) was recorded to indicate their answers.Each student did "jumping jacks" for 5 minutes and recorded the time required to regain their resting heart rate, which is listed on the table as "recovery time." Finally, each student participated in an exercise designed to measure their reaction time (in milliseconds) in catching an object dropped by a lab partner according to specified criteria.Use this table to answer the following questions.Ignore statistical problems caused by small sample size, and so on.
Table 1.3
Figure 1.3
For these questions, the data were separated and analyzed by gender.
-Refer to Table 1.3.
A.Write a hypothesis regarding gender and recovery time.
B.What is the dependent variable? What is the independent variable?
C.Create a graph using the averages from the data table.Based on these data, what do you conclude?
(Essay)
4.9/5 (36)
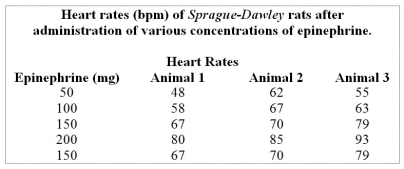
Table 1.1
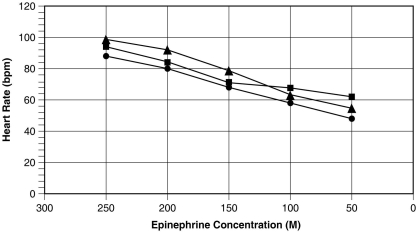 Figure 1.1
Use the table and graph below to answer the following questions.
Figure 1.1
Use the table and graph below to answer the following questions.
 -Use Table 1.1 to graph the data appropriately.What can you CONCLUDE based on the new figure?
(Essay)
5.0/5 (34)
What is the difference between a peer-reviewed article and a review article?
(Essay)
4.8/5 (36)
Adaptive significance is an important concept in physiology because it describes the
(Multiple Choice)
4.8/5 (44)
Which of the following are used to keep our systems at or near their setpoints?
(Multiple Choice)
4.9/5 (35)
There are 10 cloned horses, born on the same day, with identical chromosomes.They are each subjected to the same physical training regimen, but given daily injections of different concentrations of a particular vitamin.They all run the same race.You set up a graph to explore a relationship between race finish time and vitamin dose.
What are the labels for the graph axes?
(Essay)
4.9/5 (35)
Table 1.1
Figure 1.1
Use the table and graph below to answer the following questions.
-What is the reason for using a line graph to express the results of this study?
(Essay)
4.8/5 (38)
Explain why the prefix homeo- is used in the term homeostasis.Why do some physiologists prefer the term homeodynamics over homeostasis?
(Essay)
4.9/5 (30)
You are doing an experiment to determine if caffeine consumption affects reaction time.
A.Which is the dependent variable?
B.Which is the independent variable?
C.Briefly describe some ways you might manipulate the independent variable.
D.Name three stimuli you could use, and how you might measure reaction time for each.
E.Write an appropriate hypothesis for this study.
F.You compute the following average values from your experiment.What would be a logical conclusion for these data?
Average caffeine consumer's reaction time: 400 ms
Average noncaffeine consumer's reaction time: 650 ms
G.Sketch a simple graph to convey these results to your classmates.What kind of graph did you choose? Why? Which variable did you plot on the x-axis? Which one did you plot on the y-axis? Why?
H.Do the results of this experiment support the hypothesis you chose?
(Essay)
4.7/5 (40)
Table 1.1
Figure 1.1
Use the table and graph below to answer the following questions.
-List all of the errors in Figure 1.1.
(Essay)
4.9/5 (22)
The human environment is terrestrial, dry, and highly variable.However, our bodies expend enormous amounts of energy maintaining a constant internal environment.Studying why our bodies do this is what kind of scientific endeavor?
(Multiple Choice)
4.8/5 (30)
The following is a list of several levels of organization that make up the human body.
1)tissue
2)cell
3)organ
4)molecule
5)organism
6)organ system
The correct order from the smallest to the largest is
(Multiple Choice)
4.9/5 (28)
"Glucose is transported from blood into cells because cells require glucose to meet their energy needs." This type of explanation is
(Multiple Choice)
4.9/5 (26)
Individuals with Type I diabetes do not make enough insulin.Which of the following would be a mechanistic explanation of how insulin is used by the body?
(Multiple Choice)
4.8/5 (39)
Oxytocin is a hormone that is released in response to cervical dilation.It in turn causes more uterine contractions that will further dilate the cervix.Which type of feedback loop does oxytocin trigger?
(Multiple Choice)
4.8/5 (37)
Excretion is a function of the body.Which of the following would be considered excretion?
(Multiple Choice)
4.8/5 (37)
If a scientific model is supported or verified repeatedly by multiple investigators, it may become a
(Multiple Choice)
4.7/5 (43)
Filters
- Essay(0)
- Multiple Choice(0)
- Short Answer(0)
- True False(0)
- Matching(0)