Exam 1: Introduction to Physiology
Exam 1: Introduction to Physiology69 Questions
Exam 2: Molecular Interactions149 Questions
Exam 3: Compartmentation: Cells and Tissues160 Questions
Exam 4: Energy and Cellular Metabolism147 Questions
Exam 5: Membrane Dynamics144 Questions
Exam 6: Communication, Integration, and Homeostasis82 Questions
Exam 7: Introduction to the Endocrine System76 Questions
Exam 8: Neurons: Cellular and Network Properties229 Questions
Exam 9: The Central Nervous System107 Questions
Exam 10: Sensory Physiology175 Questions
Exam 11: Efferent Division: Autonomic and Somatic Motor Control78 Questions
Exam 12: Muscles106 Questions
Exam 13: Integrative Physiology I: Control of Body Movement76 Questions
Exam 14: Cardiovascular Physiology191 Questions
Exam 15: Blood Flow and the Control of Blood Pressure125 Questions
Exam 16: Blood114 Questions
Exam 17: Mechanics of Breathing118 Questions
Exam 18: Gas Exchange and Transport87 Questions
Exam 19: The Kidneys76 Questions
Exam 20: Integrative Physiology II: Fluid and Electrolyte Balance83 Questions
Exam 21: The Digestive System140 Questions
Exam 22: Metabolism and Energy Balance133 Questions
Exam 23: Endocrine Control of Growth and Metabolism100 Questions
Exam 24: The Immune System120 Questions
Exam 25: Integrative Physiology III: Exercise62 Questions
Exam 26: Reproduction and Development124 Questions
Select questions type
A physician basing clinical decisions on primary research published in biomedical literature is doing ________ medicine.
(Multiple Choice)
4.8/5  (30)
(30)
You are interested in learning more about Parkinson's disease, a neurological disorder that primarily affects motor function.Which is the best source to begin your investigation?
(Multiple Choice)
4.9/5 (36)
Which of the following is one of Cannon's "internal secretions"?
(Multiple Choice)
4.8/5 (35)
Following is a table of data collected from one section of an 8 a.m.physiology lab.There were 20 students present, 10 men and 10 women.Information collected from the students included their height, weight, age, gender, and resting pulse rate.In addition, the students were surveyed to see if they smoked cigarettes, considered themselves "regular exercisers," if they had consumed caffeine the morning of the lab, and if they had eaten breakfast that day.A "y" or "n" (yes or no) was recorded to indicate their answers.Each student did "jumping jacks" for 5 minutes and recorded the time required to regain their resting heart rate, which is listed on the table as "recovery time." Finally, each student participated in an exercise designed to measure their reaction time (in milliseconds) in catching an object dropped by a lab partner according to specified criteria.Use this table to answer the following questions.Ignore statistical problems caused by small sample size, and so on.
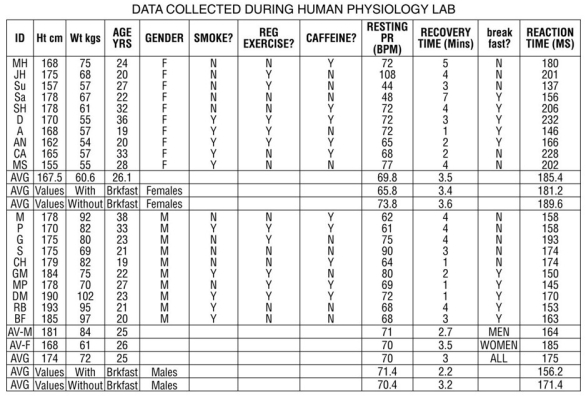 Table 1.3
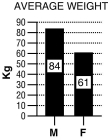 Figure 1.3
For these questions, the data were separated and analyzed by gender.
-Refer to Table 1.3.
A.Disregarding gender, write a hypothesis that expresses the relationship between weight and height.
B.What is the dependent variable? What is the independent variable?
C.From the data in Table 1.3, construct a graph that examines this relationship.
Figure 1.3
For these questions, the data were separated and analyzed by gender.
-Refer to Table 1.3.
A.Disregarding gender, write a hypothesis that expresses the relationship between weight and height.
B.What is the dependent variable? What is the independent variable?
C.From the data in Table 1.3, construct a graph that examines this relationship.
(Essay)
4.9/5 (37)
A horse runs 10 races, each a mile long, during a 6-month period, and you are interested in determining if the horse's race time changes with experience.You set up a graph to display the race finish times of this horse.
Which type of graph would be best to display the race finish times of this horse?
(Multiple Choice)
4.9/5 (34)
________ are kept within normal range by physiological control mechanisms which are used if the variable strays too far from its ________.
(Multiple Choice)
4.7/5 (33)
Sarah has just flown around the world in the last 48 hours.She is having trouble sleeping, a condition known as insomnia.How do you think Sarah's long flights and her insomnia are related to biological rhythms?
(Essay)
4.8/5 (35)
How genetics influences the body's response to drugs is called
(Multiple Choice)
4.8/5 (33)
You conduct an experiment on twenty 18-year-old male subjects to see how various levels of exercise influence heart rate.Explain why only 18-year-old males were used as subjects.
(Essay)
4.7/5 (32)
You want to display data on the finish times of the 10 fastest race horses in a single race at the Kentucky Derby.
What would the labels be for the graph axes?
(Essay)
4.7/5 (30)
You conduct an experiment on twenty 18-year-old male subjects to see how various intensities of exercise influence heart rate.Which of the following is/are considered a dependent variable?
(Multiple Choice)
5.0/5 (29)
Provide an example of a control system.Be sure to include the three main components: an input signal, a controller, and an output signal.
(Essay)
4.8/5 (35)
Following is a table of data collected from one section of an 8 a.m.physiology lab.There were 20 students present, 10 men and 10 women.Information collected from the students included their height, weight, age, gender, and resting pulse rate.In addition, the students were surveyed to see if they smoked cigarettes, considered themselves "regular exercisers," if they had consumed caffeine the morning of the lab, and if they had eaten breakfast that day.A "y" or "n" (yes or no) was recorded to indicate their answers.Each student did "jumping jacks" for 5 minutes and recorded the time required to regain their resting heart rate, which is listed on the table as "recovery time." Finally, each student participated in an exercise designed to measure their reaction time (in milliseconds) in catching an object dropped by a lab partner according to specified criteria.Use this table to answer the following questions.Ignore statistical problems caused by small sample size, and so on.
Table 1.3
Figure 1.3
For these questions, the data were separated and analyzed by gender.
-Table 1.3 shows data on various factors that may or may not be related to resting pulse rate, time to recovery to resting pulse rate after a few minutes of exercise, and reaction time measured by how quickly a student could press a keyboard key after seeing a computer-generated prompt.For each question below, write a testable hypothesis, identify the dependent and independent variables, sketch an appropriate graph of the results, and draw a conclusion from the data presented in the table.Discuss your results.
A.Does caffeine consumption have an effect on resting pulse rate?
B.Does age play a role in resting pulse rate? Does weight?
C.Is there a relationship between eating breakfast and recovery time?
D.Is there a relationship between reaction time and height?
E.Do women who smoke show differences in their resting pulse rates compared to female nonsmokers or to male smokers and nonsmokers?
F.Does regular exercise have an effect on resting pulse rate?
(Essay)
4.8/5 (34)
Filters
- Essay(0)
- Multiple Choice(0)
- Short Answer(0)
- True False(0)
- Matching(0)