Exam 7: The Normal Probability Distributions
Exam 1: Data Collection34 Questions
Exam 2: Organizing and Summarizing Data30 Questions
Exam 3: Numerically Summarizing Data66 Questions
Exam 4: Describing the Relation Between Two Variables92 Questions
Exam 5: Probability91 Questions
Exam 6: Discrete Probability Distributions32 Questions
Exam 7: The Normal Probability Distributions36 Questions
Exam 8: Sampling Distributions12 Questions
Exam 9: Estimating the Value of a Parameter Using Confidence Intervals24 Questions
Exam 10: Hypothesis Tests Regarding a Parameter36 Questions
Exam 11: Inference on Two Samples65 Questions
Exam 12: Inference on Categorical Data16 Questions
Exam 13: Comparing Three or More Means15 Questions
Exam 14: Inference of the Least-Squares Regression Model28 Questions
Select questions type
Determine the area under the standard normal curve that lies between:
-z = -0.4 and z = 0.4
(Multiple Choice)
4.9/5  (44)
(44)
Determine the area under the standard normal curve that lies between:
-z = 0.3 and z = 1.4
(Multiple Choice)
4.7/5 (35)
Find the indicated z-score.
-Find the z-score having area 0.86 to its right under the standard normal curve; that is, find  .
.
(Multiple Choice)
4.7/5 (30)
The amount of soda a dispensing machine pours into a 12 ounce can of soda follows a normal distribution with a standard deviation of 0.06 ounce. Every can that has more than 12.15 ounces of soda poured into it causes a spill and the can needs to go through a special cleaning process before it can be sold. What is the mean amount of soda the machine should dispense if the company wants to limit the percentage that need to be cleaned because of spillage to 3%?
(Multiple Choice)
4.7/5 (37)
Determine the area under the standard normal curve that lies between:
-z = 1 and z = 2
(Multiple Choice)
4.7/5 (32)
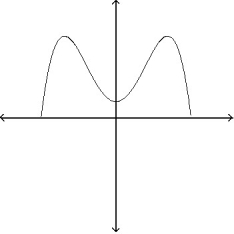
Determine whether the graph can represent a normal curve. If it cannot, explain why.
-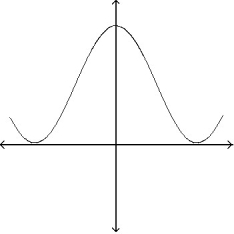
(Multiple Choice)
4.8/5 (37)
The graph of a normal curve is given. Use the graph to identify the value of ? and ?. 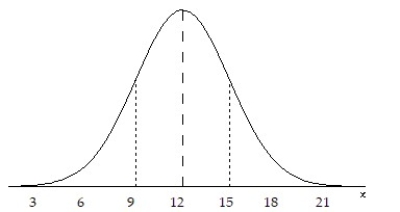
(Multiple Choice)
4.9/5 (37)
Compare a graph of the normal density function with mean of 0 and standard deviation of 1 with a graph of a normal density function with mean equal to 4 and standard deviation of 1. The graphs would
(Multiple Choice)
4.7/5 (45)
Determine whether the graph can represent a normal curve. If it cannot, explain why.
-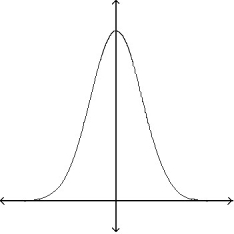
(Multiple Choice)
4.9/5 (29)
Determine whether the graph can represent a normal curve. If it cannot, explain why.
-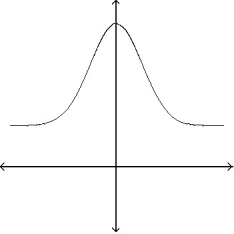
(Multiple Choice)
4.8/5 (37)
High temperatures in a certain city for the month of August follow a uniform distribution over the interval  to
to  What is the probability that a randomly selected August day has a high temperature that exceeded
(Multiple Choice)
4.7/5 (46)
Find the indicated z-score.
-Find the z-score for which the area under the standard normal curve to its left is 0.96
(Multiple Choice)
4.9/5 (38)
Find the indicated z-score.
-Find the z-score for which the area under the standard normal curve to its left is 0.04.
(Multiple Choice)
4.8/5 (27)
Draw a normal curve with ? = 60 and ? = 10. Label the mean and the inflection points.
(Multiple Choice)
4.9/5 (41)
The analytic scores on a standardized aptitude test are known to be normally distributed with mean  and standard deviation
  (a) Draw a normal curve with the parameters labeled.
(b) Shade the region that represents the proportion of test takers who scored less than 725.
(c) Suppose the area under the normal curve to the left of X = 725 is 0.8413. Provide two interpretations of this result.
(a) Draw a normal curve with the parameters labeled.
(b) Shade the region that represents the proportion of test takers who scored less than 725.
(c) Suppose the area under the normal curve to the left of X = 725 is 0.8413. Provide two interpretations of this result.
(Essay)
4.7/5 (38)
Determine whether the graph can represent a normal curve. If it cannot, explain why.
-
(Multiple Choice)
4.9/5 (35)
Filters
- Essay(0)
- Multiple Choice(0)
- Short Answer(0)
- True False(0)
- Matching(0)