Exam 11: Inference on Two Samples
Exam 1: Data Collection34 Questions
Exam 2: Organizing and Summarizing Data30 Questions
Exam 3: Numerically Summarizing Data66 Questions
Exam 4: Describing the Relation Between Two Variables92 Questions
Exam 5: Probability91 Questions
Exam 6: Discrete Probability Distributions32 Questions
Exam 7: The Normal Probability Distributions36 Questions
Exam 8: Sampling Distributions12 Questions
Exam 9: Estimating the Value of a Parameter Using Confidence Intervals24 Questions
Exam 10: Hypothesis Tests Regarding a Parameter36 Questions
Exam 11: Inference on Two Samples65 Questions
Exam 12: Inference on Categorical Data16 Questions
Exam 13: Comparing Three or More Means15 Questions
Exam 14: Inference of the Least-Squares Regression Model28 Questions
Select questions type
To perform a hypothesis test of two population proportions, the pooled estimate of p must be determined. The pooled estimate,  , is
, is
(Multiple Choice)
4.8/5  (35)
(35)
Perform the appropriate hypothesis test.
-A random sample of  individuals results in
  successes. An independent sample of
  individuals results in
  successes. Does this represent sufficient evidence to conclude that
  at the α = 0.01 level of significance?
(Essay)
4.9/5 (25)
Test the hypothesis that  =
=  . Two samples are randomly selected from each population. The sample statistics are given below. Use α = 0.05.
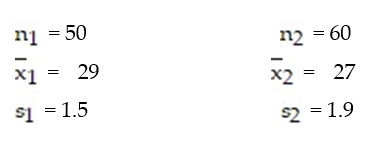
(Essay)
4.9/5 (33)
Data sets A and B are dependent. Find  .
. 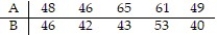 Assume that the paired data came from a population that is normally distributed.
(Multiple Choice)
4.8/5 (27)
Test the hypothesis that  <
<  . Use α = 0.10. The sample statistics listed below are from independent samples.Sample statistics:
  = 550,
  = 121, and
  = 690,
  = 195
= 195
(Essay)
4.7/5 (32)
Find the test statistic to test the hypothesis that  =
=  . Two samples are randomly selected from each population. The sample statistics are given below. Use ? = 0.05.
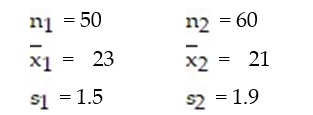
(Multiple Choice)
4.8/5 (31)
Find the test statistic, z, to test the hypothesis that  <
<  . Use ? = 0.10. The sample statistics listed below are from independent samples.Sample statistics:
  = 550,
  = 121, and
  = 690,
  = 195
= 195
(Multiple Choice)
4.8/5 (21)
A well-known study of 22,000 male physicians was conducted to determine if taking aspirin daily reduces the chances of a heart attack. Half of the physicians were given a regular dose of aspirin while the other half was given placebos. Six years later, among those who took aspirin, 104 suffered heart attacks while among those who took placebos, 189 suffered heart attacks. Does it appear that the aspirin can reduce the number of heart attacks among the sample group that took aspirin? Use α = 0.01.
(Essay)
4.8/5 (45)
We are interested in comparing the average supermarket prices of two leading colas in the Tampa area. Our sample was taken by randomly going to each of eight supermarkets and recording the price of a six-pack of cola of each brand. The data are shown in the following table. Find a 98% confidence interval for the difference in mean price of brand 1 and brand 2. Assume that the paired data came from a population that is normally distributed. 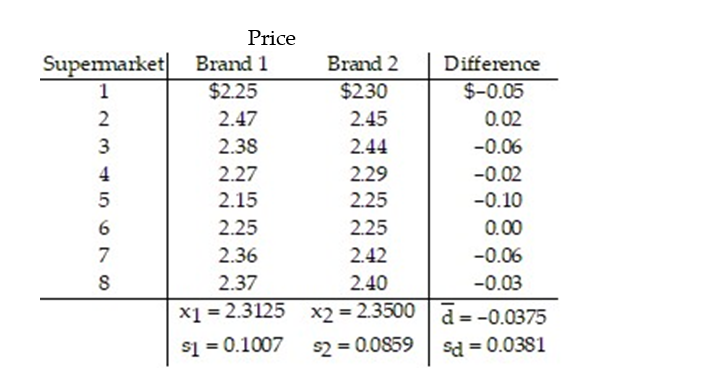
(Multiple Choice)
4.8/5 (24)
Construct a 95% confidence interval for data sets A and B. Data sets A and B are dependent. 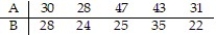 Assume that the paired data came from a population that is normally distributed.
(Multiple Choice)
4.9/5 (36)
Find the test statistic, t, to test the hypothesis that  ?
?  . Two samples are randomly selected and come from populations that are normal. The sample statistics are given below.
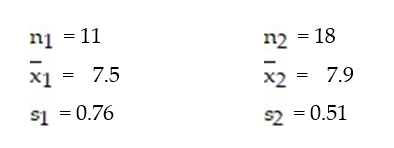
(Multiple Choice)
4.8/5 (45)
Data sets A and B are dependent. Test the claim that  = 0. Use α = 0.05.
 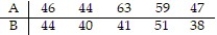 Assume that the paired data came from a population that is normally distributed.
(Essay)
4.8/5 (31)
Test the hypothesis that  <
<  . Two samples are randomly selected from each population. The sample statistics are given below. Use α = 0.05.
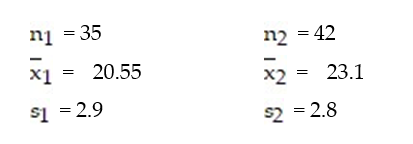
(Essay)
4.8/5 (31)
What is the  for testing differences of the means of two independent samples?
(Multiple Choice)
4.8/5 (36)
Perform the appropriate hypothesis test.
-The table below shows the weights, in pounds, of seven subjects before and after following a particular diet program for three months. Does the sample evidence suggest that the diet program is effective in reducing weight? Use the  level of significance. Assume that the differenced data come from a population that is normally distributed with no outliers.
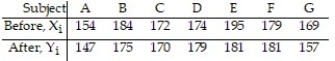
(Essay)
4.8/5 (35)
A football coach claims that players can increase their strength by taking a certain supplement. To test the theory, the coach randomly selects 9 athletes and gives them a strength test using a bench press. The results are listed below. Thirty days later, after regular training using the supplement, they are tested again. The new results are listed below. Test the claim that the supplement is effective in increasing the athletes' strength. Use α = 0.05. Assume that the distribution is normally distributed. 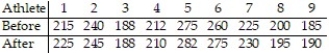
(Essay)
4.8/5 (33)
Find the test statistic, z, to test the hypothesis that  =
=  . Use ? = 0.05. The sample statistics listed below are from independent samples.Sample statistics:
  = 50,
= 50,  = 35, and
  = 60,
= 60,  = 40
= 40
(Multiple Choice)
4.9/5 (36)
A new weight-reducing technique, consisting of a liquid protein diet, is currently undergoing tests before its introduction into the market. A typical test performed is the following: The weights of a random sample of five people are recorded before they are introduced to the liquid protein diet. The five individuals are then instructed to follow the liquid protein diet for 3 weeks. At the end of this period, their weights (in pounds) are again recorded. The results are listed in the table. Let  be the true mean weight of individuals before starting the diet and let
  be the true mean weight of individuals after 3 weeks on the diet. Calculate a 90% confidence interval for the difference between the mean weights before and after the diet is used. Assume that the paired data came from a population that is normally distributed.
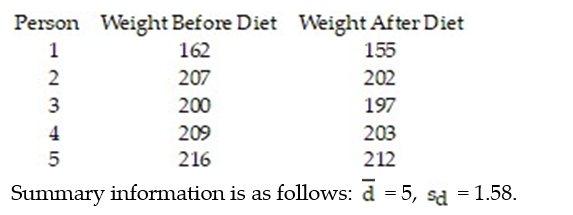
(Essay)
4.7/5 (36)
To construct a confidence interval for the difference of two population proportions the samples must be independently obtained random samples, both must consist of less than 5% of the population, and
(Multiple Choice)
4.8/5 (33)
Data sets A and B are dependent. Test the claim that  =0. Use α = 0.01.
 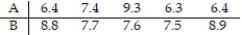 Assume that the paired data came from a population that is normally distributed.
(Essay)
4.8/5 (30)
Filters
- Essay(0)
- Multiple Choice(0)
- Short Answer(0)
- True False(0)
- Matching(0)