Exam 1: An Introduction to Data and Functions
Exam 1: An Introduction to Data and Functions149 Questions
Exam 2: Rates of Change and Linear Functions215 Questions
Exam 3: When Lines Meet: Linear Systems81 Questions
Exam 4: The Laws of Exponents and Logarithms: Measuring the Universe201 Questions
Exam 5: Growth and Decay: An Introduction to Exponential Functions146 Questions
Exam 6: Logarithmic Links: Logarithmic and Exponential Functions108 Questions
Exam 7: Power Functions109 Questions
Exam 8: Quadratics and the Mathematics of Motion127 Questions
Exam 9: New Functions From Old137 Questions
Select questions type
Use the graph below to answer the questions.
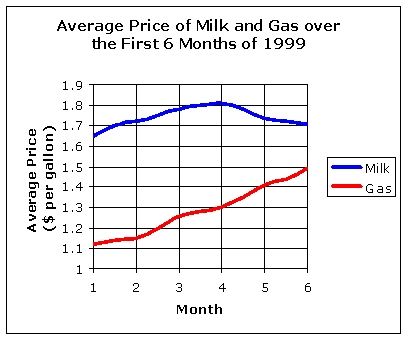 -
A) What was the average gas price in month 6 of 1999? (Round to the nearest $0.05.)
B) In what month did gas prices reach $1.40 per gallon?
C) After which month did milk prices begin to decrease?
-
A) What was the average gas price in month 6 of 1999? (Round to the nearest $0.05.)
B) In what month did gas prices reach $1.40 per gallon?
C) After which month did milk prices begin to decrease?
(Short Answer)
4.9/5  (31)
(31)
The table shows starting salaries from a survey of recent college graduates:
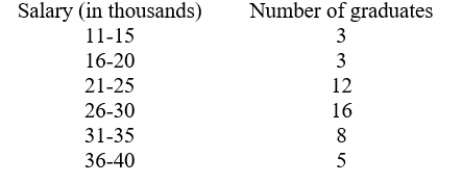 What is the relative frequency of a graduate having a salary between $36,000 and $40,000?
Round your answer to 2 decimal places, if necessary
What is the relative frequency of a graduate having a salary between $36,000 and $40,000?
Round your answer to 2 decimal places, if necessary
(Multiple Choice)
4.8/5 (38)
On a recent test in a College Algebra class the following scores were recorded:
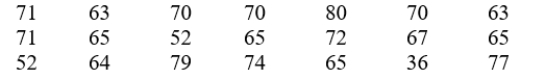 Find each of the following:
A) the meanand
and
B) the medianIf necessary, round answers to 2 decimal places.
Find each of the following:
A) the meanand
and
B) the medianIf necessary, round answers to 2 decimal places.
(Short Answer)
4.8/5 (36)
For the given equation  , which could never be a value of y?
(Multiple Choice)
4.7/5 (34)
If Fancis pays 23% of each paycheck for payroll deductions, which function would properly describe her take-home pay, T, as a function of her gross pay, p?
(Multiple Choice)
4.8/5 (32)
Which one of the following ordered pairs that satisfy the equation. 
(Multiple Choice)
4.9/5 (39)
Below is a pie chart of the sources of points in a College Algebra class.
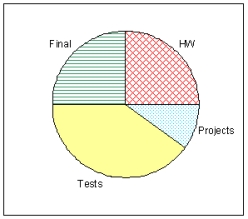 According to the chart, what is the smallest source of points in the class?
(Multiple Choice)
4.8/5 (33)
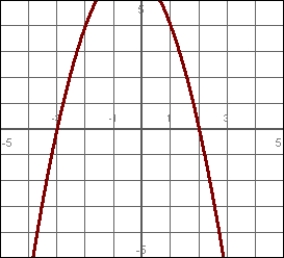
Over what interval(s) is the function negative?
Write your answer in interval notation. If two intervals are needed, write your answer in the form  .
.
(Essay)
4.8/5 (43)
Determine whether the ordered pair, (-3,-5), satisfies the equation.
(True/False)
4.8/5 (30)
A plumber charges $20 for a house call plus $27 per hour while she is there, up to a maximum of 8 hours.
Write a formula to describe the price, p, of a house call by the plumber in terms of the hours, h, spent at the house.
(Short Answer)
4.8/5 (41)
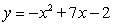
Over what interval(s) is the function negative?
Write your answer in interval notation.
(Essay)
4.8/5 (36)
Find the mean of the data set below.
43, 34, 46, 38, 43, 37, 42, 23, 27, 40, 43, 21
Round your answer to 2 decimal places.
(Short Answer)
4.9/5 (32)
In a group of seven people the heights, in inches, of six are known to be 66, 61, 69, 69, 63, and 68. If the mean height of all seven people is 65, then what must the seventh height be?
(Short Answer)
4.9/5 (29)
Use technology to graph the function and then determine the interval on which the graph is concave downward. State your answer in interval notation.
y = 5x3 - 3x
(Essay)
4.9/5 (39)
Use technology to graph the function and then determine the interval over which the function is increasing. State your answer in interval notation.
y = 5x4 - 40x2
(Essay)
4.8/5 (21)
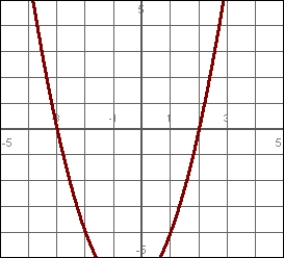
On what interval is this graph increasing. State your answer in interval notation.
(Essay)
4.8/5 (33)
The graph below shows the number of birds at a bird feeder as a function of time.
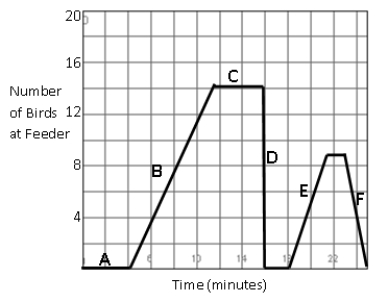 What event most likely occurred during interval E?
(Multiple Choice)
5.0/5 (42)
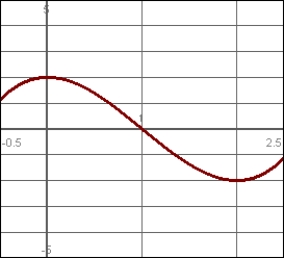
Identify the maximum of this function over the interval shown.
(Short Answer)
4.9/5 (35)
Consider the table giving values for height and weight of 5 individuals.
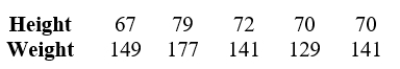 Determine which of the following best describes the relationship between height and weight.
(Multiple Choice)
4.8/5 (32)
Filters
- Essay(0)
- Multiple Choice(0)
- Short Answer(0)
- True False(0)
- Matching(0)