Exam 1: An Introduction to Data and Functions
Exam 1: An Introduction to Data and Functions149 Questions
Exam 2: Rates of Change and Linear Functions215 Questions
Exam 3: When Lines Meet: Linear Systems81 Questions
Exam 4: The Laws of Exponents and Logarithms: Measuring the Universe201 Questions
Exam 5: Growth and Decay: An Introduction to Exponential Functions146 Questions
Exam 6: Logarithmic Links: Logarithmic and Exponential Functions108 Questions
Exam 7: Power Functions109 Questions
Exam 8: Quadratics and the Mathematics of Motion127 Questions
Exam 9: New Functions From Old137 Questions
Select questions type
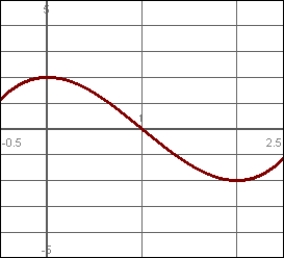
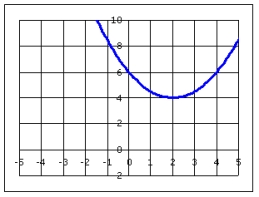
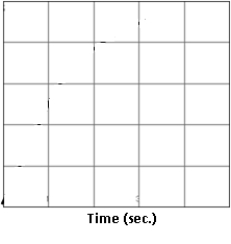
Identify the minimum of this function over the interval shown.
(Short Answer)
4.7/5  (32)
(32)
Missy's excavating charges a set-up fee of $225.00 plus an additional $70.00 for each hour on the job. Write a function to express the charge (C) for a job as a function of the hours (h) required to complete the job.
(Short Answer)
4.8/5 (44)
Find each of the following for the set of data: 20, 17, 21, 23, 19, 23, 25
A) the meanand
and
B) the median.Round your answer to 2 decimal places.
(Short Answer)
4.8/5 (34)
The following three graphs describe two cars, A and B.
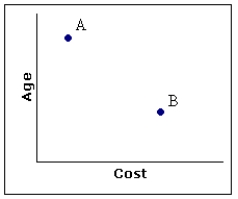
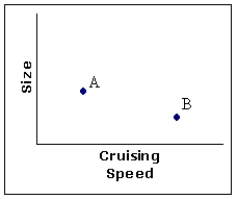
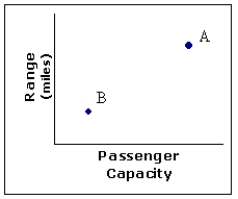 Which of the following is true?
(Multiple Choice)
5.0/5 (33)
Over what interval is the function concave up?
Write your answer in interval notation.
(Essay)
4.8/5 (37)
The following grid shows the graph of the function, 
 .
Find the range of the function.
.
Find the range of the function.
(Multiple Choice)
4.8/5 (40)
Jeremy has instructed his accountant to split any deposits into his retirement account into the investments as shown in the pie chart.
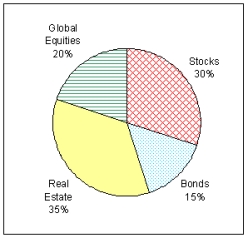 If Jeremy's accountant allocates $4,200 to global equities, how much was his investment into his retirement account?
(Short Answer)
4.7/5 (34)
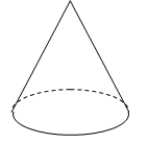
If the tank pictured here is filled with a pipe flowing at a constant rate, sketch the graph of the height of the water in the tank as a function of time.
(Essay)
5.0/5 (31)
The bar chart below was created using the number of children of each of the last 20 U.S. Presidents.
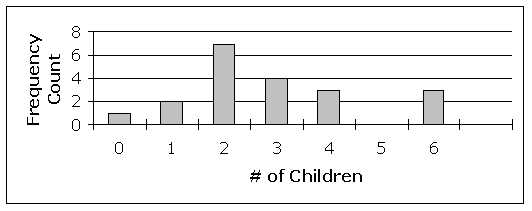 Find the relative frequency of presidents who had 1 children.
(Multiple Choice)
4.9/5 (35)
Over what interval is the function concave down?
Write your answer in interval notation.
(Essay)
4.9/5 (40)
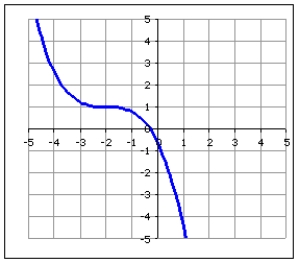
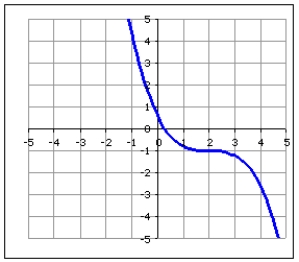
Use technology to graph the function and then determine the interval over which the function is decreasing. State your answer in interval notation.
y = x3 - 3x
(Essay)
5.0/5 (35)
The following grid shows the graph of the function,  .
.
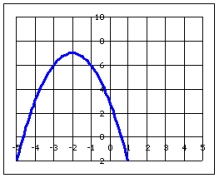 Find the range of the function.
(Essay)
4.9/5 (32)
For the following data:
61, 59, 77, 71, 66, 69, 73, 63, 66, 62, 79, 66, 71, 16, 74, 65, 60, 69, 78, 75, 73, 76, 66, 61, 77
Calculate
A) the mean (round to 2 decimal places),
B) the median, and
C) then identify any number that should be considered an outlier.Round your answer to 2 decimal places.
(Short Answer)
4.8/5 (29)
Which two values are excluded from the domain of the function below?
 Give the values in order from smallest to largest.
(Short Answer)
4.8/5 (32)
Use technology to graph the function and then determine the interval over which the function is increasing. State your answer in interval notation.
y = x3 - 48x
(Essay)
4.7/5 (41)
Find the median of the data set below.
44, 80, 65, 52, 35, 75, 53, 84, 44, 60, 79
(Multiple Choice)
4.9/5 (51)
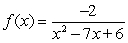
Find the domain for this function. Express the domain in interval notation.
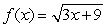
(Essay)
4.9/5 (38)
The following table shows data for the number of speeding tickets issued and the number of traffic deaths in Barron County by year.
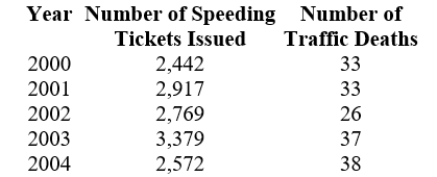 In which year were there the most traffic deaths?
(Short Answer)
4.7/5 (32)
Use the graph below to answer the question.
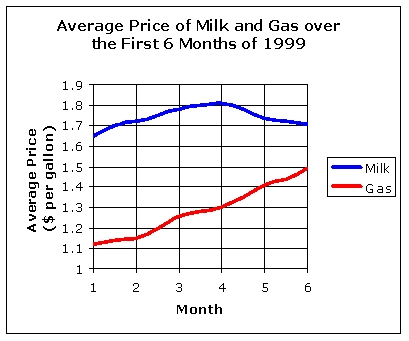 -
Choose the average gas price in month 4 of 1999.
-
Choose the average gas price in month 4 of 1999.
(Multiple Choice)
4.9/5 (40)
The following graph shows the population (in thousands) of two cities, City 1 and City 2.
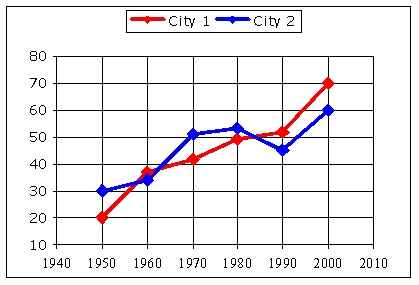 What was the difference in population (To the nearest 1,000.) between the two cities in 2000?
(Short Answer)
4.9/5 (26)
Filters
- Essay(0)
- Multiple Choice(0)
- Short Answer(0)
- True False(0)
- Matching(0)