Exam 1: An Introduction to Data and Functions
Exam 1: An Introduction to Data and Functions149 Questions
Exam 2: Rates of Change and Linear Functions215 Questions
Exam 3: When Lines Meet: Linear Systems81 Questions
Exam 4: The Laws of Exponents and Logarithms: Measuring the Universe201 Questions
Exam 5: Growth and Decay: An Introduction to Exponential Functions146 Questions
Exam 6: Logarithmic Links: Logarithmic and Exponential Functions108 Questions
Exam 7: Power Functions109 Questions
Exam 8: Quadratics and the Mathematics of Motion127 Questions
Exam 9: New Functions From Old137 Questions
Select questions type
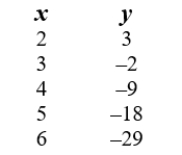
Find an equation that represents the relationship between x and y in this table:
(Short Answer)
4.9/5  (36)
(36)
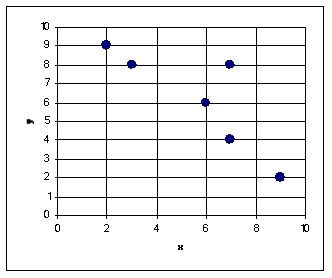
Based upon the scatterplot choose the answer that best describes the relationship between x and y.
(Multiple Choice)
5.0/5 (36)
Solve the following equation for y in terms of x and then express in f(x) form.
6x(8 - x) = 3x - y
(Short Answer)
4.7/5 (30)
Consider the table giving values for variables x and y.
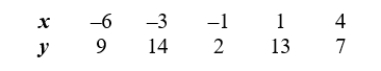 Determine whether y is a function of x.
(Multiple Choice)
4.8/5 (33)
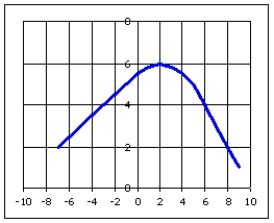
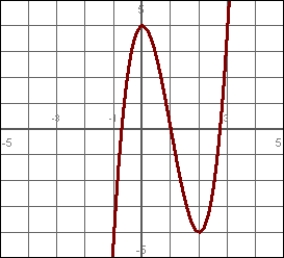
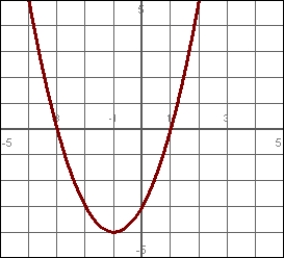
Estimate (to the nearest integer) the maximum of the function whose graph is given.
(Short Answer)
4.7/5 (41)
On what interval is this graph decreasing. State your answer in interval notation.
(Essay)
4.9/5 (38)
Find the domain of the function, 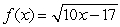 .
Write your answer in interval notation using fractions.
.
Write your answer in interval notation using fractions.
(Essay)
4.9/5 (33)
Find the median of the data set below.
28, 64, 37, 36, 19, 59, 44, 68, 28, 49, 63
(Short Answer)
4.8/5 (41)
Which of the following CANNOT be the mean of the data set represented in the following histogram.
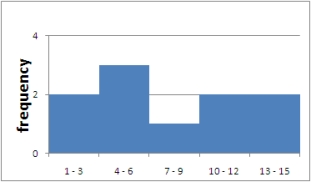
(Multiple Choice)
4.7/5 (38)
Use the graph below to answer the questions.
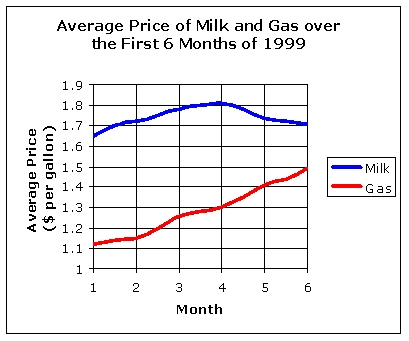 -
After which month did milk prices begin to decrease?
-
After which month did milk prices begin to decrease?
(Multiple Choice)
4.9/5 (38)
The frequency table below describes the age distribution of students in a college algebra class. Based on this information, estimate the largest and smallest possible values for the mean age of this class.
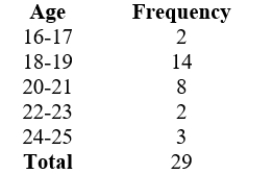 A) Find the smallest possible meanand
and
B) the largest possible mean.Round your answers to 2 decimals if necessary.
A) Find the smallest possible meanand
and
B) the largest possible mean.Round your answers to 2 decimals if necessary.
(Short Answer)
4.8/5 (30)
The following graph shows the populations (in thousands) of two cities, City 1 and City 2.
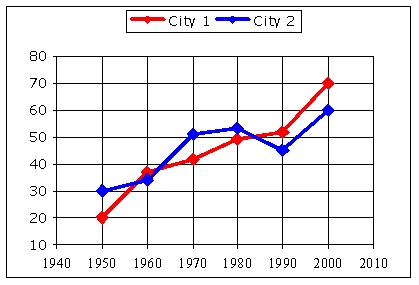 Find the range of population for City 1.
(Multiple Choice)
4.8/5 (33)
For the following data:
64, 63, 72, 75, 62, 74, 62, 64, 77, 72, 76, 13, 58, 72, 70, 59, 72, 67
Calculate
A) the mean (Round to 2 decimal places.),
B) the median, and
C) then identify any number that should be considered an outlier.Round your answer to 2 decimal places.
(Short Answer)
4.9/5 (35)
Below is a pie chart of the sources of points in a College Algebra class.
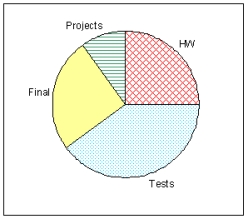 According to the chart, what is the smallest source of points in the class?
(Short Answer)
4.8/5 (37)
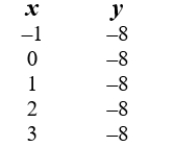
Find an equation that represents the relationship between x and y in this table:
(Short Answer)
4.9/5 (24)
Over what interval(s) is the function positive?
Write your answer in interval notation. If two intervals are needed, write your answer in the form  .
.
(Essay)
4.9/5 (43)
Filters
- Essay(0)
- Multiple Choice(0)
- Short Answer(0)
- True False(0)
- Matching(0)