Exam 1: An Introduction to Data and Functions
Exam 1: An Introduction to Data and Functions149 Questions
Exam 2: Rates of Change and Linear Functions215 Questions
Exam 3: When Lines Meet: Linear Systems81 Questions
Exam 4: The Laws of Exponents and Logarithms: Measuring the Universe201 Questions
Exam 5: Growth and Decay: An Introduction to Exponential Functions146 Questions
Exam 6: Logarithmic Links: Logarithmic and Exponential Functions108 Questions
Exam 7: Power Functions109 Questions
Exam 8: Quadratics and the Mathematics of Motion127 Questions
Exam 9: New Functions From Old137 Questions
Select questions type
Select all of the following ordered pairs that satisfy the equation. 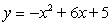
(Multiple Choice)
4.8/5  (35)
(35)
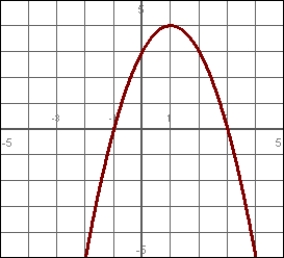
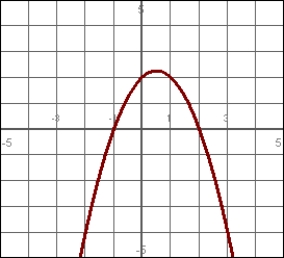
On what interval is this graph increasing. State your answer in interval notation.
(Essay)
5.0/5 (38)
Jeremy has instructed his accountant to split a $12,000 deposit to his retirement account into the investments as shown in the pie chart.
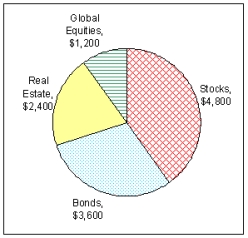 What percent of his investment was allocated to global equities?
(Short Answer)
4.8/5 (35)
Over what interval is the function increasing?
Write your answer in interval notation.
(Essay)
4.8/5 (36)
For the following data:
68, 67, 75, 78, 66, 77, 66, 68, 80, 75, 79, 11, 62, 75, 73, 63, 75, 71
Calculate
A) the mean (Round to 2 decimal places.),
B) the median, and
C) then identify any number that should be considered an outlier.Round your answer to 2 decimal places.
(Short Answer)
5.0/5 (41)
For the following data:
51, 47, 63, 59, 54, 57, 61, 51, 54, 50, 65, 54, 59, 15, 62, 53, 50, 57, 64, 63, 61, 62, 54, 51, 65
Which of the following is the median?
(Multiple Choice)
4.7/5 (32)
Over what interval(s) is the function positive?
Write your answer in interval notation.
(Essay)
4.7/5 (35)
Solve the following equation for y in terms of x and then express in f(x) form.
5(y - 2) = 4y + 2x(x + 3)
(Short Answer)
4.9/5 (39)
The 2006 graduates of Bottom Line University all got great jobs. Their starting annual salaries are: $32,000; $50,000; $54,000; $60,000; $46,000; $46,000; $37,000; $53,000; $51,000; and $2.5 million
(At 6'10'' "Hoops" Johnson is playing professional basketball.)
Which of the mean or median is a better indication of what their graduates typically make?
(Multiple Choice)
4.9/5 (36)
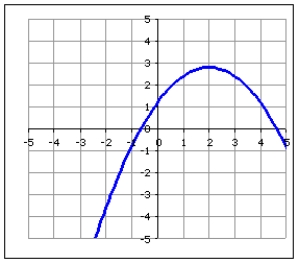
Each of these tanks is being filled with a pipe that delivers 6 gallons of water per minute. Which graph best represents the height of the water in each tank as a function of time?
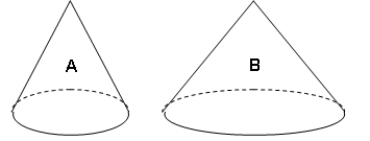
(Multiple Choice)
4.8/5 (37)
The frequency table below describes the age distribution of students in a college algebra class. Based on this information, estimate the smallest possible value for the mean age of this class.
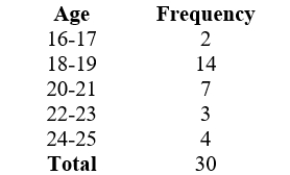 Which of the following is the smallest possible mean?
Round your answers to 2 decimals if necessary.
Which of the following is the smallest possible mean?
Round your answers to 2 decimals if necessary.
(Multiple Choice)
4.8/5 (31)
Use the bar chart below to find the mean of the data set.
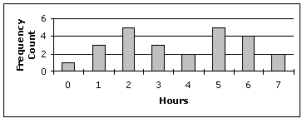 Round your answer to 2 decimal places.
(Short Answer)
4.8/5 (32)
The bar chart below was created using the number of children of each of the last 20 U.S. Presidents.
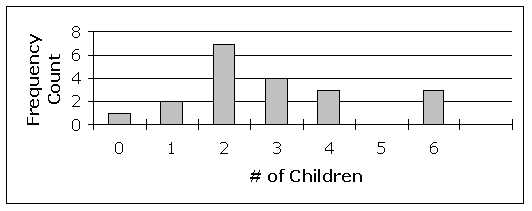 Find the relative frequency of presidents who had 3 children.
(Short Answer)
4.9/5 (47)
Which one of the following ordered pairs that satisfy the equation. 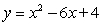
(Multiple Choice)
4.8/5 (33)
Find the median of the data set below.
28, 60, 46, 31, 13, 55, 40, 64, 24, 57
(Short Answer)
5.0/5 (31)
Filters
- Essay(0)
- Multiple Choice(0)
- Short Answer(0)
- True False(0)
- Matching(0)