Exam 1: An Introduction to Data and Functions
Exam 1: An Introduction to Data and Functions149 Questions
Exam 2: Rates of Change and Linear Functions215 Questions
Exam 3: When Lines Meet: Linear Systems81 Questions
Exam 4: The Laws of Exponents and Logarithms: Measuring the Universe201 Questions
Exam 5: Growth and Decay: An Introduction to Exponential Functions146 Questions
Exam 6: Logarithmic Links: Logarithmic and Exponential Functions108 Questions
Exam 7: Power Functions109 Questions
Exam 8: Quadratics and the Mathematics of Motion127 Questions
Exam 9: New Functions From Old137 Questions
Select questions type
The 1999 graduates of Bottom Line University all got great jobs. Their starting annual salaries are:
$36,000; $32,000; $42,000; $41,000; $40,000; $38,000; $60,000; $43,000; $52,000; and $2.3 million
(At 6'10'' "Hoops" Johnson is playing professional basketball.)
A) A headline in the alumni newsletter boasts "'1999 Graduates Highest Paid Yet. Salaries Average $_________" (Complete the headline.)
B) Is the mean or the median a better indication of what the graduates are typically making?
(Short Answer)
4.8/5  (39)
(39)
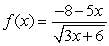
The following table gives values for a function y=f(x).
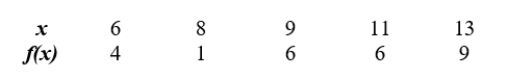 For what value(s) of x does f(x)=6 ?
(Multiple Choice)
4.7/5 (37)
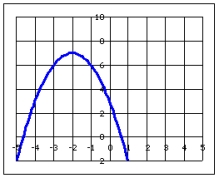
Over what interval is the function concave down?
Write your answer in interval notation.
(Essay)
4.9/5 (30)
Find the domain for this function. Express the domain in interval notation.
(Essay)
4.8/5 (32)
The area of a circle is described by the function  , where r is the radius of the circle. Find the area of a circle with radius 6.
(Multiple Choice)
4.8/5 (32)
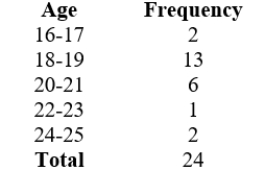
Below is age data from a University of Massachusetts college algebra class.
 Which is the relative frequency of students whose ages are in the interval from 18-20? (rounded to 2 decimal places)
(Multiple Choice)
4.8/5 (31)
Consider the table giving values for variables s and t.
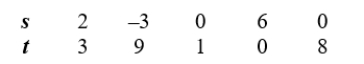 Determine which of the following best describes the relationship between s and t.
(Multiple Choice)
4.9/5 (23)
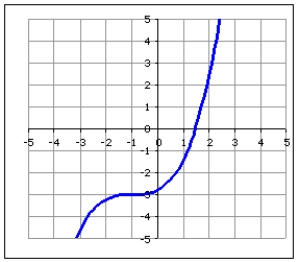
The following grid shows the graph of the function,  .
.
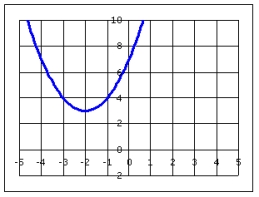 Find the range of the function.
(Essay)
4.9/5 (42)
Determine the domain of this graph. Express the answer in interval notation.
(Essay)
4.8/5 (34)
State the interval on which this graph is concave upward. State your answer in interval notation.
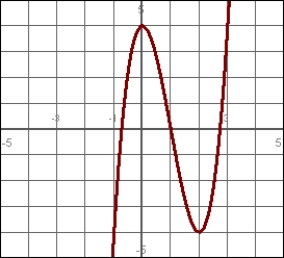
(Essay)
4.7/5 (29)
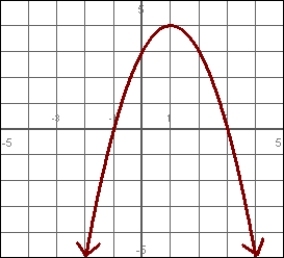
The following grid shows the graph of the function,  .
.
 Find the range of the function.
(Multiple Choice)
4.7/5 (39)
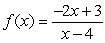
Find the domain for this function. Express the domain in interval notation.
(Essay)
4.8/5 (38)
The following table gives the median salary of an employee at Gossnell, Inc. for various years of seniority.
 Which variable would be used as the output of the function?
(Short Answer)
4.8/5 (38)
Select all of the following ordered pairs that satisfy the equation. 
(Multiple Choice)
4.9/5 (37)
The following table gives values for a function y=f(x).
 Evaluate f(5).
(Short Answer)
4.8/5 (37)
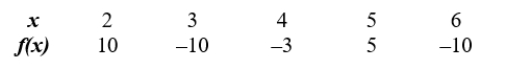
Given the graph of velocity as a function of time, choose the best graph to represent distance traveled as a function of time.
(Multiple Choice)
4.8/5 (32)
The frequency table below describes the age distribution of students in a college algebra class. Based on this information, estimate the largest possible value for the mean age of this class.
 Which of the following is the largest possible mean?
Round your answers to 2 decimals if necessary.
Which of the following is the largest possible mean?
Round your answers to 2 decimals if necessary.
(Multiple Choice)
4.8/5 (39)
Filters
- Essay(0)
- Multiple Choice(0)
- Short Answer(0)
- True False(0)
- Matching(0)