Exam 10: Multiple Regression
Exam 1: Collecting Data68 Questions
Exam 2: Describing Data127 Questions
Exam 3: Confidence Intervals149 Questions
Exam 4: Hypothesis Tests117 Questions
Exam 5: Approximating With a Distribution74 Questions
Exam 6: Inference for Means and Proportions166 Questions
Exam 7: CHI-Square Tests for Categorical Variables45 Questions
Exam 8: Anova to Compare Means53 Questions
Exam 9: Inference for Regression123 Questions
Exam 10: Multiple Regression72 Questions
Select questions type
Use the following to answer the questions below:
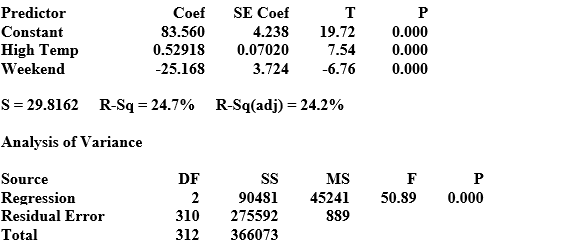
A small university is concerned with monitoring the electricity usage in its Student Center, and its officials want to better understand what influences the amount of electricity used on a given day. They collected data on the amount of electricity used in the Student Center each day and the daily high temperature for nearly a year. They also made note of whether each day was a weekend or not (1 = Saturday/Sunday and 0 = Monday - Friday). Regression output is provided.
Helpful notes: 1) Electricity usage is measured in kilowatt hours, 2) During the cold months, the Student Center is heated by gas, not electricity, and 3) Air conditioning the building during the warm months does use electricity.
The regression equation is Electricity = 83.6 + 0.529 High Temp - 25.2 Weekend
 -Interpret
  for this model.
(Essay)
4.7/5  (31)
(31)
Use the following to answer the questions below:
Output for a model to predict the GPAs of students at a small university based on their Math SAT scores, Verbal SAT scores, and the number of hours spent watching television in a typical week is provided.
The regression equation is
GPA = 1.80 + 0.00104 Math SAT + 0.00142 Verbal SAT - 0.0147 TV
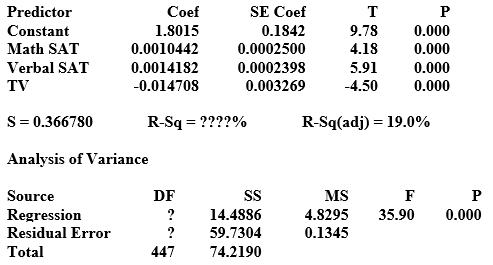 -Use the output to determine how many students were included in the sample.
(Short Answer)
4.8/5 (36)
Use the following to answer the questions below:
While many people count calories, some often don't think about calories in the beverages they consume. Starbucks, one of the leading coffeehouse chains, provides nutrition information about all of their beverages on their website. Nutrition information, including number of calories, fat (g), carbohydrates (g), and protein (g), was collected on a random sample of Starbucks' 16 ounce ("Grande") hot espresso drinks. Note that all of the drinks in the sample are made with 2% milk unless the name specifically included the term "Skinny," which is how Starbucks indicated a beverage made with nonfat milk.
The regression equation is
Calories = 6.7 + 9.61 Fat (g) + 3.43 Carbs (g) + 4.42 Protein (g)
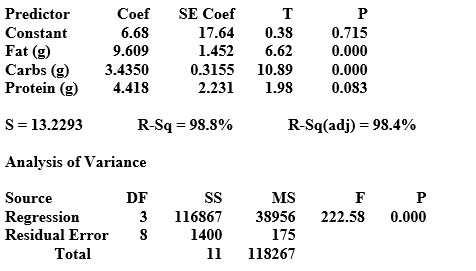 -Which predictors are significant at the 5% level?
(Multiple Choice)
5.0/5 (29)
Use the following to answer the questions below:
Output for a model to predict the GPAs of students at a small university based on their Math SAT scores, Verbal SAT scores, and the number of hours spent watching television in a typical week is provided.
The regression equation is
GPA = 1.80 + 0.00104 Math SAT + 0.00142 Verbal SAT - 0.0147 TV
-Predict the GPA of a student at this university with a Math SAT score of 600, a Verbal SAT score of 580, and who watches 5 hours of television in a typical week. Round to three decimal places.
(Multiple Choice)
4.8/5 (45)
Use the following to answer the questions below:
Fast food restaurants are required to publish nutrition information about the foods they serve. Nutrition information for a random sample of McDonald's lunch/dinner menu items (excluding sides and drinks) was obtained from their website. Output from a multiple regression analysis is provided.
The regression equation is Calories = 65.2 + 9.46 Total Fat (g) + 0.876 Cholesterol (mg) + 0.131 Sodium (mg)
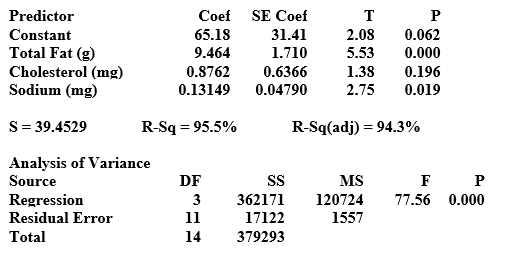 -At the 5% significance level, is the model effective according to the ANOVA test? Include all details of the test.
(Essay)
4.8/5 (40)
Use the following to answer the questions below:
Fast food restaurants are required to publish nutrition information about the foods they serve. Nutrition information for a random sample of McDonald's lunch/dinner menu items (excluding sides and drinks) was obtained from their website. Output from a multiple regression analysis is provided.
The regression equation is Calories = 65.2 + 9.46 Total Fat (g) + 0.876 Cholesterol (mg) + 0.131 Sodium (mg)
-Use the provided output to determine how many menu items were included in the sample.
(Multiple Choice)
5.0/5 (32)
Use the following to answer the questions below:
A quantitatively savvy, young couple is interested in purchasing a home in northern New York. They collected data on houses that had recently sold in the two towns they are considering. The variables they collected are the selling price of the home (in thousands of dollars), the size of the home (in square feet), the age of the home (in years), and the town in which the house is located (coded 1 = Canton and 0 = Potsdam). Output from their multiple regression analysis is provided.
The regression equation is
Price (in thousands) = 69.2 + 0.0627 Size (sq. ft.) - 0.632 Age + 1.6 Town
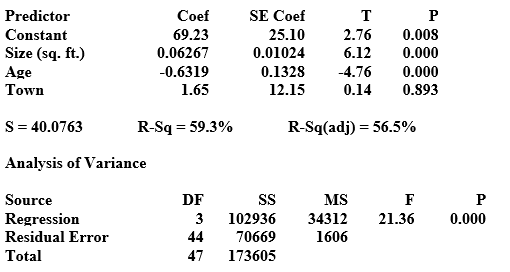 -One of the houses they are considering is a 62-year-old, 1,865 square foot house in Potsdam. What is the predicted selling price of this house? Round to three decimal places.
(Short Answer)
4.7/5 (33)
Use the following to answer the questions below:
Data were collected on the age (in years), mileage (in thousands of miles), and price (in thousands of dollars) of a random sample of used Hyundai Elantras. Output from two models are provided.
Single Predictor Model:
The regression equation is Price = 13.8 - 0.0912 Mileage
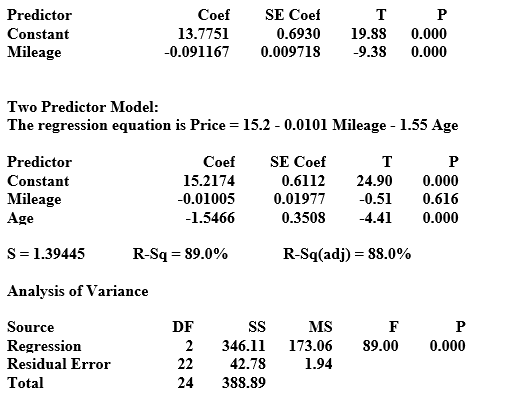 -Is the two predictor model effective according to the ANOVA test? Use α = 0.05. Include all details of the test.
(Essay)
4.9/5 (34)
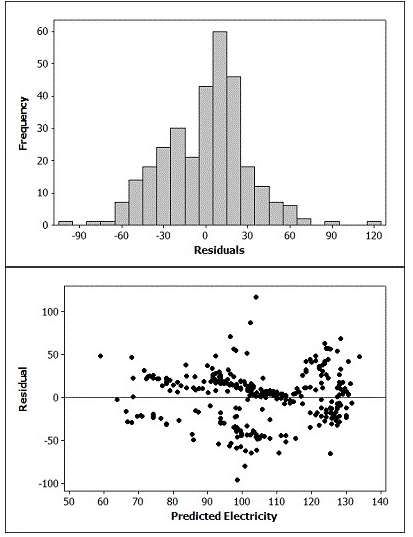
A histogram of the residuals and a scatterplot of the residuals versus the predicted values are provided. Discuss whether the conditions for a multiple linear regression are reasonable by referring to the appropriate plots.
(Essay)
4.9/5 (42)
Use the following to answer the questions below:
Output for a model to predict the GPAs of students at a small university based on their Math SAT scores, Verbal SAT scores, and the number of hours spent watching television in a typical week is provided.
The regression equation is
GPA = 1.80 + 0.00104 Math SAT + 0.00142 Verbal SAT - 0.0147 TV
-Interpret the coefficient of TV in context.
(Essay)
4.9/5 (31)
Which variable, if any, would you suggest trying to eliminate first to possibly improve this model? Describe one way in which you might determine if the model had been improved by removing that variable. Explain briefly.
(Essay)
4.8/5 (30)
Use the following to answer the questions below:
A small university is concerned with monitoring the electricity usage in its Student Center, and its officials want to better understand what influences the amount of electricity used on a given day. They collected data on the amount of electricity used in the Student Center each day and the daily high temperature for nearly a year. They also made note of whether each day was a weekend or not (1 = Saturday/Sunday and 0 = Monday - Friday). Regression output is provided.
Helpful notes: 1) Electricity usage is measured in kilowatt hours, 2) During the cold months, the Student Center is heated by gas, not electricity, and 3) Air conditioning the building during the warm months does use electricity.
The regression equation is Electricity = 83.6 + 0.529 High Temp - 25.2 Weekend
-Interpret the coefficient of High Temp in context.
(Essay)
4.9/5 (39)
Use the following to answer the questions below:
A quantitatively savvy, young couple is interested in purchasing a home in northern New York. They collected data on houses that had recently sold in the two towns they are considering. The variables they collected are the selling price of the home (in thousands of dollars), the size of the home (in square feet), the age of the home (in years), and the town in which the house is located (coded 1 = Canton and 0 = Potsdam). Output from their multiple regression analysis is provided.
The regression equation is
Price (in thousands) = 69.2 + 0.0627 Size (sq. ft.) - 0.632 Age + 1.6 Town
-One of the houses they are considering is a 92-year-old, 1,742 square foot house in Canton. What is the predicted selling price of this house? Round to three decimal places.
(Short Answer)
4.8/5 (43)
Use the following to answer the questions below:
Does the price of used cars depend upon the model? Data were collected on the selling price and age of used Hyundai Elantras (coded as Model = 1) and Toyota Camrys (coded as Model = 0). Output from the multiple regression analysis is provided.
The regression equation is Price = 14.5 - 0.619 Age - 3.63 Model
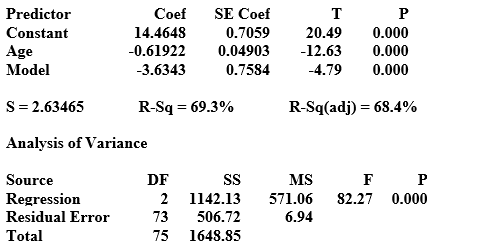 -Which predictors are significant at the 5% level? What are their p-values?
(Essay)
5.0/5 (34)
Use the following to answer the questions below:
A small university is concerned with monitoring the electricity usage in its Student Center, and its officials want to better understand what influences the amount of electricity used on a given day. They collected data on the amount of electricity used in the Student Center each day and the daily high temperature for nearly a year. They also made note of whether each day was a weekend or not (1 = Saturday/Sunday and 0 = Monday - Friday). Regression output is provided.
Helpful notes: 1) Electricity usage is measured in kilowatt hours, 2) During the cold months, the Student Center is heated by gas, not electricity, and 3) Air conditioning the building during the warm months does use electricity.
The regression equation is Electricity = 83.6 + 0.529 High Temp - 25.2 Weekend
-Is the model effective according to the ANOVA test? Use α = 0.05. Include all details of the test.
(Essay)
4.8/5 (29)
Use the following to answer the questions below:
Is there such thing as a "home court/field advantage"? The number of points scored and whether or not it was a home game are available for a sample of games played by the Boston Celtics during the regular season. The Home variable is coded as 1 = home game and 0 = away game.
The regression equation is Points Scored = 102 - 8.76 Home
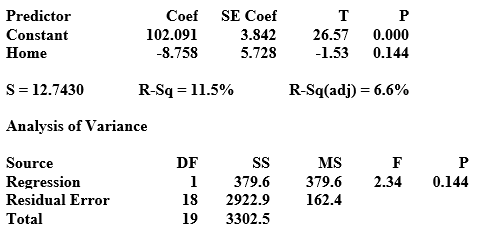 -Using α = 0.05, is there a difference in the number of points scored for home and away games? Include all details of the test.
(Essay)
4.9/5 (30)
Use the following to answer the questions below:
Is there such thing as a "home court/field advantage"? The number of points scored and whether or not it was a home game are available for a sample of games played by the Boston Celtics during the regular season. The Home variable is coded as 1 = home game and 0 = away game.
The regression equation is Points Scored = 102 - 8.76 Home
-How many points are the Celtics predicted to score in a home game? Round to one decimal place.
(Multiple Choice)
5.0/5 (30)
Use the following to answer the questions below:
A quantitatively savvy, young couple is interested in purchasing a home in northern New York. They collected data on houses that had recently sold in the two towns they are considering. The variables they collected are the selling price of the home (in thousands of dollars), the size of the home (in square feet), the age of the home (in years), and the town in which the house is located (coded 1 = Canton and 0 = Potsdam). Output from their multiple regression analysis is provided.
The regression equation is
Price (in thousands) = 69.2 + 0.0627 Size (sq. ft.) - 0.632 Age + 1.6 Town
-How many houses are used in this dataset?
(Multiple Choice)
4.8/5 (23)
Use the following to answer the questions below:
While many people count calories, some often don't think about calories in the beverages they consume. Starbucks, one of the leading coffeehouse chains, provides nutrition information about all of their beverages on their website. Nutrition information, including number of calories, fat (g), carbohydrates (g), and protein (g), was collected on a random sample of Starbucks' 16 ounce ("Grande") hot espresso drinks. Note that all of the drinks in the sample are made with 2% milk unless the name specifically included the term "Skinny," which is how Starbucks indicated a beverage made with nonfat milk.
The regression equation is
Calories = 6.7 + 9.61 Fat (g) + 3.43 Carbs (g) + 4.42 Protein (g)
-Is the model effective according to the ANOVA test? Use a 5% significance level. Include all details of the test.
(Essay)
4.8/5 (31)
Use the following to answer the questions below:
A small university is concerned with monitoring the electricity usage in its Student Center, and its officials want to better understand what influences the amount of electricity used on a given day. They collected data on the amount of electricity used in the Student Center each day and the daily high temperature for nearly a year. They also made note of whether each day was a weekend or not (1 = Saturday/Sunday and 0 = Monday - Friday). Regression output is provided.
Helpful notes: 1) Electricity usage is measured in kilowatt hours, 2) During the cold months, the Student Center is heated by gas, not electricity, and 3) Air conditioning the building during the warm months does use electricity.
The regression equation is Electricity = 83.6 + 0.529 High Temp - 25.2 Weekend
-Which predictors are significant at the 5% level? What are their p-values?
(Essay)
4.8/5 (33)
Filters
- Essay(0)
- Multiple Choice(0)
- Short Answer(0)
- True False(0)
- Matching(0)