Exam 10: Multiple Regression
Exam 1: Collecting Data68 Questions
Exam 2: Describing Data127 Questions
Exam 3: Confidence Intervals149 Questions
Exam 4: Hypothesis Tests117 Questions
Exam 5: Approximating With a Distribution74 Questions
Exam 6: Inference for Means and Proportions166 Questions
Exam 7: CHI-Square Tests for Categorical Variables45 Questions
Exam 8: Anova to Compare Means53 Questions
Exam 9: Inference for Regression123 Questions
Exam 10: Multiple Regression72 Questions
Select questions type
Use the following to answer the questions below:
Fast food restaurants are required to publish nutrition information about the foods they serve. Nutrition information for a random sample of McDonald's lunch/dinner menu items (excluding sides and drinks) was obtained from their website. Output from a multiple regression analysis is provided.
The regression equation is Calories = 65.2 + 9.46 Total Fat (g) + 0.876 Cholesterol (mg) + 0.131 Sodium (mg)
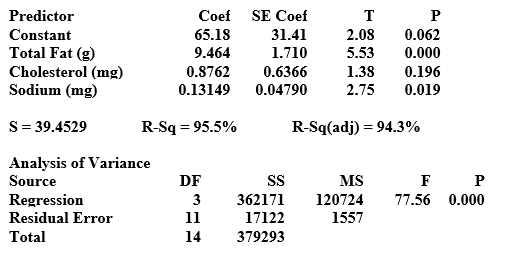 -What are the explanatory variables used in this model?
Free
(Multiple Choice)
4.9/5  (39)
(39)
Correct Answer: Verified
A
Use the following to answer the questions below:
Output for a model to predict the GPAs of students at a small university based on their Math SAT scores, Verbal SAT scores, and the number of hours spent watching television in a typical week is provided.
The regression equation is
GPA = 1.80 + 0.00104 Math SAT + 0.00142 Verbal SAT - 0.0147 TV
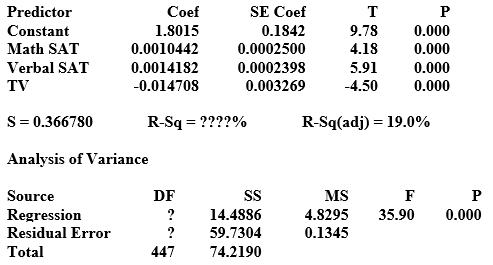 -At the 5% significance level, is the model effective according to the ANOVA test. Include all details of the test.
Free
(Essay)
4.8/5 (37)
Correct Answer:Verified
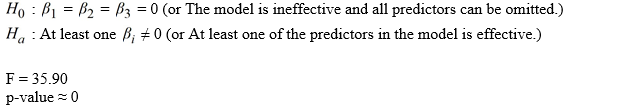
There is very strong evidence that at least one of the predictors in the model is effective for explaining the GPA of students at this university.
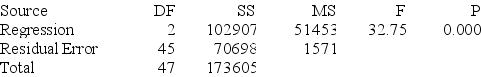
Regression output for a model that omits Town as a predictor is provided. Assuming that the residuals for this reduced model do not indicate any problems with using multiple regression, is this model an improvement over the model that uses Size, Age, and Town as predictors? Statistically justify your answer by discussing at least two quantitative criteria.
The regression equation is
Price (in thousands) = 70.6 + 0.0624 Size (sq. ft.) - 0.635 Age
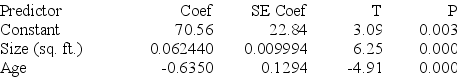 S = 39.6368 R-Sq = 59.3% R-Sq(adj) = 57.5%
Analysis of Variance
S = 39.6368 R-Sq = 59.3% R-Sq(adj) = 57.5%
Analysis of Variance
Free
(Essay)
4.8/5 (31)
Correct Answer:Verified
Yes, the model without Town (i.e., using only Size and Age) is an improvement over the three predictor model because
1) There are no insignificant predictors in the model.
2) The  is not change at all (59.3% in both models).
3) The residual standard error is lower in the two-predictor model (39.64 versus 40.08 in the three-predictor model).
4) The F-statistic is larger in the two-predictor model (32.75 versus 21.36 in the three-predictor model).
5) The Adjusted  is larger in the two-predictor model (57.5% versus 56.5% in the three-predictor model).
Use the following to answer the questions below:
Fast food restaurants are required to publish nutrition information about the foods they serve. Nutrition information for a random sample of McDonald's lunch/dinner menu items (excluding sides and drinks) was obtained from their website. Output from a multiple regression analysis is provided.
The regression equation is Calories = 65.2 + 9.46 Total Fat (g) + 0.876 Cholesterol (mg) + 0.131 Sodium (mg)
-Which predictor appears to be the most important in this model? Explain briefly.
(Multiple Choice)
4.9/5 (33)
Use the following to answer the questions below:
Does the price of used cars depend upon the model? Data were collected on the selling price and age of used Hyundai Elantras (coded as Model = 1) and Toyota Camrys (coded as Model = 0). Output from the multiple regression analysis is provided.
The regression equation is Price = 14.5 - 0.619 Age - 3.63 Model
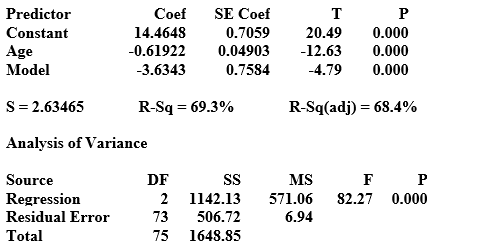 -Interpret the coefficient of Model in context.
(Essay)
4.7/5 (25)
Use the following to answer the questions below:
While many people count calories, some often don't think about calories in the beverages they consume. Starbucks, one of the leading coffeehouse chains, provides nutrition information about all of their beverages on their website. Nutrition information, including number of calories, fat (g), carbohydrates (g), and protein (g), was collected on a random sample of Starbucks' 16 ounce ("Grande") hot espresso drinks. Note that all of the drinks in the sample are made with 2% milk unless the name specifically included the term "Skinny," which is how Starbucks indicated a beverage made with nonfat milk.
The regression equation is
Calories = 6.7 + 9.61 Fat (g) + 3.43 Carbs (g) + 4.42 Protein (g)
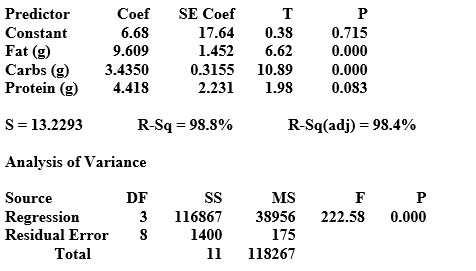 -Interpret
  for this model.
(Essay)
4.8/5 (36)
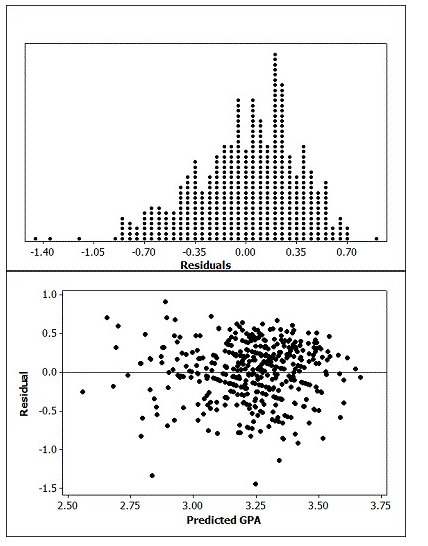
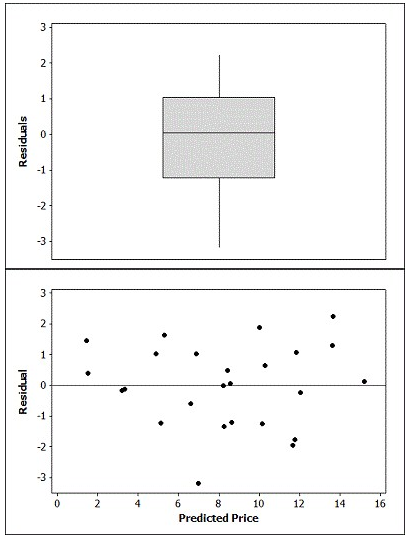
A dotplot of the residuals and a scatterplot of the residuals versus the predicted values are provided. Discuss whether the conditions for a multiple linear regression are reasonable by referring to the appropriate plots.
(Essay)
4.9/5 (27)
Use the following to answer the questions below:
A small university is concerned with monitoring the electricity usage in its Student Center, and its officials want to better understand what influences the amount of electricity used on a given day. They collected data on the amount of electricity used in the Student Center each day and the daily high temperature for nearly a year. They also made note of whether each day was a weekend or not (1 = Saturday/Sunday and 0 = Monday - Friday). Regression output is provided.
Helpful notes: 1) Electricity usage is measured in kilowatt hours, 2) During the cold months, the Student Center is heated by gas, not electricity, and 3) Air conditioning the building during the warm months does use electricity.
The regression equation is Electricity = 83.6 + 0.529 High Temp - 25.2 Weekend
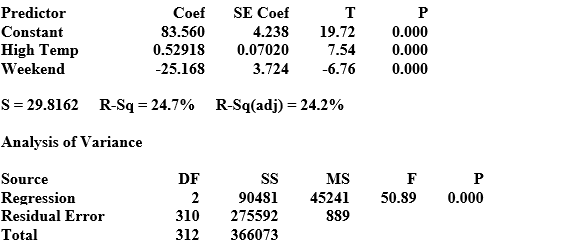 -How many days are included in the sample?
(Multiple Choice)
4.7/5 (30)
Use the following to answer the questions below:
The ANOVA table from a multiple regression analysis is provided.
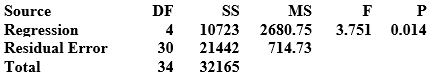 -How large is the sample size?
(Short Answer)
4.7/5 (40)
A boxplot of the residuals and a scatterplot of the residuals versus the predicted values from the two predictor model are provided. Discuss whether the conditions for a multiple linear regression are reasonable by referring to the appropriate plots.
(Essay)
4.8/5 (34)
Use the following to answer the questions below:
Does the price of used cars depend upon the model? Data were collected on the selling price and age of used Hyundai Elantras (coded as Model = 1) and Toyota Camrys (coded as Model = 0). Output from the multiple regression analysis is provided.
The regression equation is Price = 14.5 - 0.619 Age - 3.63 Model
-Interpret  for this model.
(Essay)
4.9/5 (37)
Use the following to answer the questions below:
Does the price of used cars depend upon the model? Data were collected on the selling price and age of used Hyundai Elantras (coded as Model = 1) and Toyota Camrys (coded as Model = 0). Output from the multiple regression analysis is provided.
The regression equation is Price = 14.5 - 0.619 Age - 3.63 Model
-What is the predicted price of a 6-year-old Hyundai Elantra? Round to three decimal places.
(Short Answer)
4.8/5 (29)
Use the following to answer the questions below:
Data were collected on the age (in years), mileage (in thousands of miles), and price (in thousands of dollars) of a random sample of used Hyundai Elantras. Output from two models are provided.
Single Predictor Model:
The regression equation is Price = 13.8 - 0.0912 Mileage
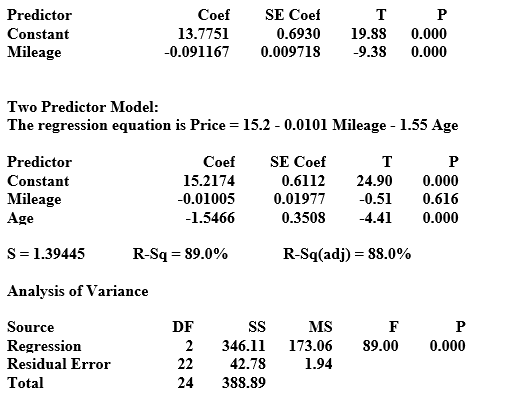 -What is the explanatory variable used in the single predictor model?
(Essay)
4.9/5 (36)
Use the following to answer the questions below:
Fast food restaurants are required to publish nutrition information about the foods they serve. Nutrition information for a random sample of McDonald's lunch/dinner menu items (excluding sides and drinks) was obtained from their website. Output from a multiple regression analysis is provided.
The regression equation is Calories = 65.2 + 9.46 Total Fat (g) + 0.876 Cholesterol (mg) + 0.131 Sodium (mg)
-Which predictors are significant at the 5% level? What are their p-values?
(Multiple Choice)
4.8/5 (35)
Use the following to answer the questions below:
Fast food restaurants are required to publish nutrition information about the foods they serve. Nutrition information for a random sample of McDonald's lunch/dinner menu items (excluding sides and drinks) was obtained from their website. Output from a multiple regression analysis is provided.
The regression equation is Calories = 65.2 + 9.46 Total Fat (g) + 0.876 Cholesterol (mg) + 0.131 Sodium (mg)
-One of the menu items in the sample is the "McDouble,"
which has 390 calories, 12 grams of fat, 65 mg of cholesterol, and 850 mg of sodium. What is the residual for the McDouble? Round your answer to two decimal places.
(Short Answer)
4.9/5 (30)
Use the following to answer the questions below:
While many people count calories, some often don't think about calories in the beverages they consume. Starbucks, one of the leading coffeehouse chains, provides nutrition information about all of their beverages on their website. Nutrition information, including number of calories, fat (g), carbohydrates (g), and protein (g), was collected on a random sample of Starbucks' 16 ounce ("Grande") hot espresso drinks. Note that all of the drinks in the sample are made with 2% milk unless the name specifically included the term "Skinny," which is how Starbucks indicated a beverage made with nonfat milk.
The regression equation is
Calories = 6.7 + 9.61 Fat (g) + 3.43 Carbs (g) + 4.42 Protein (g)
-Interpret the coefficient of Fat in context.
(Essay)
4.7/5 (34)
Use the following to answer the questions below:
Does the price of used cars depend upon the model? Data were collected on the selling price and age of used Hyundai Elantras (coded as Model = 1) and Toyota Camrys (coded as Model = 0). Output from the multiple regression analysis is provided.
The regression equation is Price = 14.5 - 0.619 Age - 3.63 Model
-Is the model effective according to the ANOVA test? Use α = 0.05. Include all details of the test.
(Essay)
4.7/5 (40)
Use the following to answer the questions below:
Output for a model to predict the GPAs of students at a small university based on their Math SAT scores, Verbal SAT scores, and the number of hours spent watching television in a typical week is provided.
The regression equation is
GPA = 1.80 + 0.00104 Math SAT + 0.00142 Verbal SAT - 0.0147 TV
-Which predictors are significant at the 5% level?
(Multiple Choice)
4.8/5 (35)
Use the following to answer the questions below:
A small university is concerned with monitoring the electricity usage in its Student Center, and its officials want to better understand what influences the amount of electricity used on a given day. They collected data on the amount of electricity used in the Student Center each day and the daily high temperature for nearly a year. They also made note of whether each day was a weekend or not (1 = Saturday/Sunday and 0 = Monday - Friday). Regression output is provided.
Helpful notes: 1) Electricity usage is measured in kilowatt hours, 2) During the cold months, the Student Center is heated by gas, not electricity, and 3) Air conditioning the building during the warm months does use electricity.
The regression equation is Electricity = 83.6 + 0.529 High Temp - 25.2 Weekend
-Another possible predictor they recorded was the average temperature over the course of each day. Regression output for the model that uses High Temp, Weekend, and Avg. Temp is provided. Explain why these results differ so drastically from those for the two-predictor model.
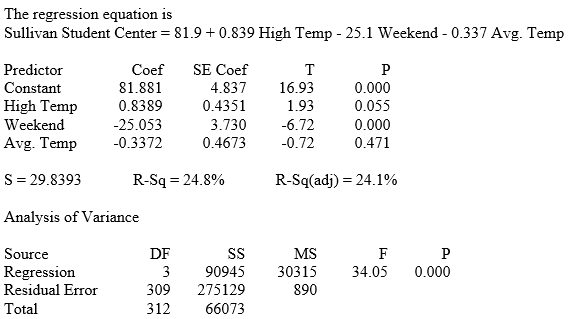
(Essay)
4.7/5 (35)
Filters
- Essay(0)
- Multiple Choice(0)
- Short Answer(0)
- True False(0)
- Matching(0)