Exam 5: Approximating With a Distribution
Exam 1: Collecting Data68 Questions
Exam 2: Describing Data127 Questions
Exam 3: Confidence Intervals149 Questions
Exam 4: Hypothesis Tests117 Questions
Exam 5: Approximating With a Distribution74 Questions
Exam 6: Inference for Means and Proportions166 Questions
Exam 7: CHI-Square Tests for Categorical Variables45 Questions
Exam 8: Anova to Compare Means53 Questions
Exam 9: Inference for Regression123 Questions
Exam 10: Multiple Regression72 Questions
Select questions type
Use the following to answer the questions below:
A set of hypotheses, some information from one or more samples, and a standard error from a randomization distribution are provided. Find the value of the standardized z-test statistic.
-Test  :
:  =
=  and
and  :
: 
 when the samples have


 and
and  The standard error of
  from the randomization distribution is 3.2.
(Multiple Choice)
4.7/5  (40)
(40)
Use the following to answer the questions below:
Heights of 10-year-old girls (5th graders) follow an approximately normal distribution with mean inches and standard deviation of inches.
-What proportion of 10-year-old girls are taller than 60 inches (5 feet)? Report your answer with three decimal places.
(Short Answer)
4.8/5 (39)
Use the following to answer the questions below:
Find the endpoint(s) on a N(0, 1) density with the given property. Round to three decimal places.
-The area to the right of the endpoint is about 0.85.
(Multiple Choice)
4.8/5 (27)
Use the following to answer the questions below:
A Gallup survey of 1,012 randomly selected U.S. adults (age 18 and over), 53% said that they were dissatisfied with the quality of education students receive in kindergarten through grade 12. The bootstrap distribution (based on 5,000 samples) is provided.
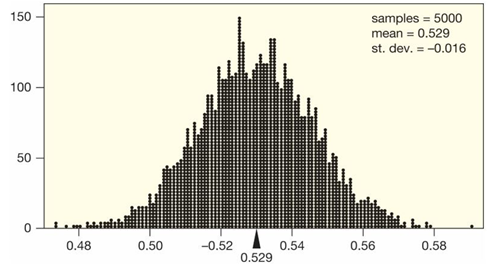 -The standard error from the bootstrap distribution is SE = 0.016. Use the normal distribution to construct and interpret a 99% confidence interval for the proportion of U.S. adults who are dissatisfied with the education students receive in kindergarten through grade 12. Round to three decimal places.
(Essay)
4.7/5 (48)
Use the following to answer the questions below:
A set of hypotheses, some information from one or more samples, and a standard error from a randomization distribution are provided. Find the value of the standardized z-test statistic.
-Test  : p = 0.75 versus
  : p > 0.75 when the sample has
 and
and 
(Multiple Choice)
4.7/5 (33)
Use the following to answer the questions below:
Heights of 10-year-old girls (5th graders) follow an approximately normal distribution with mean inches and standard deviation of inches.
-What is the first quartile of heights of 10-year-old girls? Report your answer with one decimal place.
(Multiple Choice)
4.8/5 (36)
Use the following to answer the questions below:
It is generally believed that the heights of adults males in the U.S. are approximately normally distributed with mean 70 inches (5 feet, 10 inches) and standard deviation 3 inches and that the heights of adult females in the U.S. are also approximately normally distributed with mean 64 inches (5 feet, 4 inches) and standard deviation 2.5 inches. A small university is considering custom ordering beds for their dorm rooms. Answer the following questions about the lengths of beds in dorm rooms at this university.
-The university plans on ordering custom sized beds such that 99% of male students are expected to fit in them when lying perfectly straight. What length beds should they order? Round your answer to the nearest inch.
(Multiple Choice)
4.8/5 (22)
Use the following to answer the questions below:
A student suspects that the length of songs currently on her Spotify playlist are approximately normally distributed with a mean of 257 seconds and standard deviation 62 seconds.
-What proportion of songs are between 240 and 360 seconds (4 minutes and 6 minutes)? Report your answer with three decimal places.
(Short Answer)
4.8/5 (37)
Use the following to answer the questions below:
Find the z* values based on a standard normal distribution for each of the following. Round to three decimal places.
-A 66% confidence interval for a slope.
(Multiple Choice)
4.8/5 (31)
Use the following to answer the questions below:
A Gallup survey of 1,012 randomly selected U.S. adults (age 18 and over), 53% said that they were dissatisfied with the quality of education students receive in kindergarten through grade 12. The bootstrap distribution (based on 5,000 samples) is provided.
-A Gallup survey of 1,012 randomly selected U.S. adults (age 18 and over), 53% said that they were dissatisfied with the quality of education students receive in kindergarten through grade 12. Use the normal distribution to test if the proportion of U.S. adults who are dissatisfied with the education that students receive in kindergarten through grade 12 differs from 50%. The randomization distribution for this test is approximately normal and the standard error is  Include all details of the test and use a 5% significance level.
(Essay)
5.0/5 (23)
Use the following to answer the questions below:
Heights of 10-year-old girls (5th graders) follow an approximately normal distribution with mean inches and standard deviation of inches.
-What proportion of 10-year-old girls are shorter than 48 inches (4 feet)? Report your answer with four decimal places.
(Short Answer)
4.7/5 (24)
Use the following to answer the questions below:
Select the answer closest to the specified areas for a normal density. Round to three decimal places.
-The area between 43 and 100 on a N(14, 3) distribution.
(Multiple Choice)
4.7/5 (36)
Use the following to answer the questions below:
Final grades in Professor Albert's large calculus class are approximately normally distributed with a mean of 76 (%) and standard deviation of 8 (%).
-Draw a sketch of this normal distribution and label at least three points on the horizontal axis.
(Essay)
4.8/5 (33)
Use the following to answer the questions below:
Find the endpoint(s) on the normal density curve with the given property. Round to three decimal places.
-The area to the left of the endpoint on a N(54, 2.5) curve is about 0.15.
(Multiple Choice)
4.8/5 (36)
Filters
- Essay(0)
- Multiple Choice(0)
- Short Answer(0)
- True False(0)
- Matching(0)