Exam 2: Functions
Exam 1: Linear Functions and Change148 Questions
Exam 2: Functions138 Questions
Exam 3: Quadratic Functions46 Questions
Exam 4: Exponential Functions94 Questions
Exam 5: Logarithmic Functions87 Questions
Exam 6: Transformations of Functions and Their Graphs85 Questions
Exam 7: Trigonometry and Periodic Functions178 Questions
Exam 8: Triangle Trigonometry and Polar Coordinates43 Questions
Exam 9: Trigonometric Identities, Models, and Complex Numbers106 Questions
Exam 10: Compositions, Inverses, and Combinations of Functions69 Questions
Exam 11: Polynomial and Rational Functions145 Questions
Exam 12: Vectors and Matrices104 Questions
Exam 13: Sequences and Series81 Questions
Exam 14: Parametric Equations and Conic Sections128 Questions
Select questions type
Assume that height is a function of age and that is the average height (in inches) for females in the US at age years. What is a reasonable domain for ?
(Multiple Choice)
4.8/5  (38)
(38)
An organization has 175 raffle tickets to sell for each. From the proceeds of the sale, they will award the winning ticket holder . The profit, , that the organization receives is a function of the number, , of tickets sold. Assuming they sell at least one ticket, the range of this function is ------------- ------------ -----------.
(Short Answer)
4.8/5 (42)
The number of bacteria in a sample grows slowly at first, but then grows with increasing rapidity. Does the following figure accurately represent the number of bacteria in a sample graphed against time?
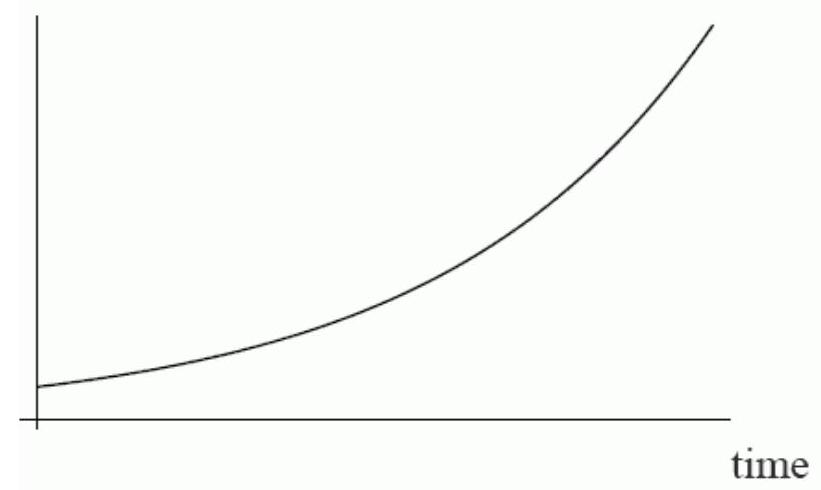
(True/False)
4.9/5 (42)
Let .
a) Graph .
b) Use the graph to find the range of the function on the domain .
(Short Answer)
5.0/5 (30)
If is decreasing and concave down on , which of the following must be true.
(Multiple Choice)
4.8/5 (37)
Use the table below to answer the following questions.
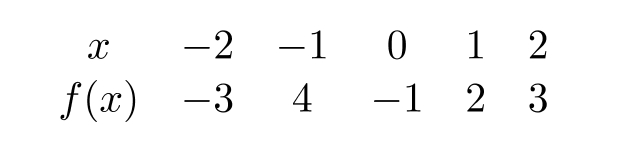 If , compute
A)
B)
C)
If , compute
A)
B)
C)
(Short Answer)
4.7/5 (47)
The data points for the following table are graphed in the figures below.
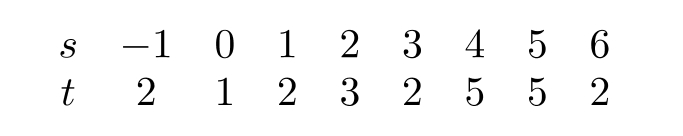
 For the graph that is a function, we could write -----------=f(----------------), where is ------------ the dependent variable and ----------------- is the independent variable. (Fill in each blank with an or a " ").
(Short Answer)
4.8/5 (44)
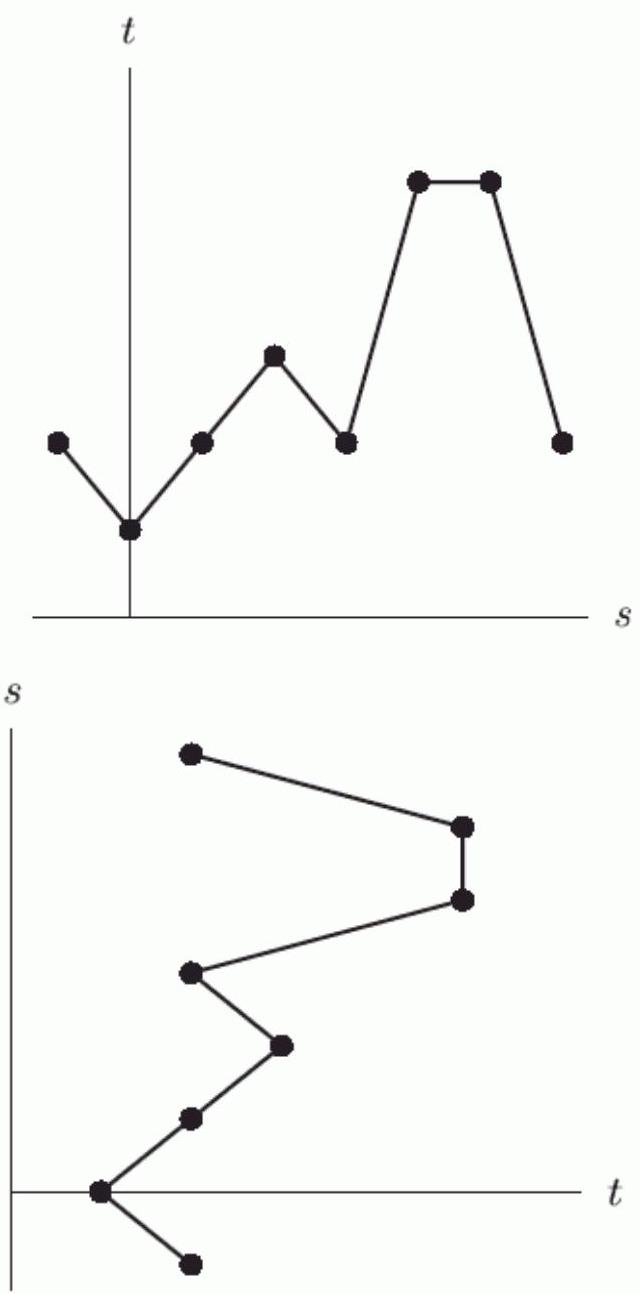
The data points for the following table are graphed in the figure below.
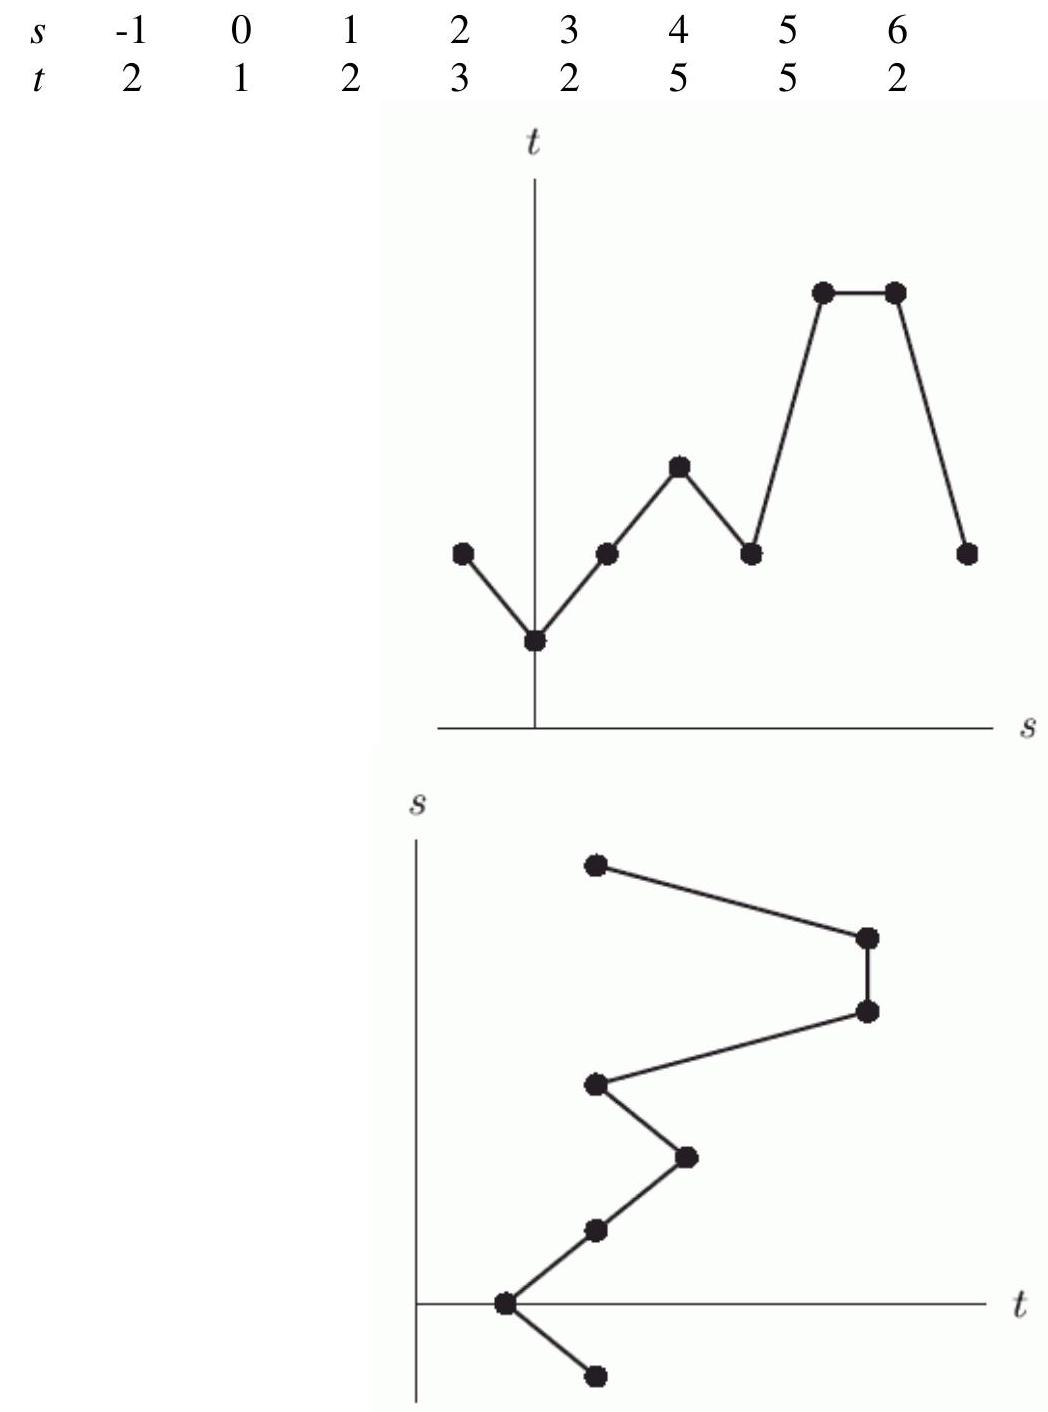 For the graph that is a function, approximate .
(Short Answer)
4.8/5 (40)
The function gives the weekly demand for DVD rentals at Joe's Videolog when Joe charges to rent a DVD. What does mean in practical terms?
(Multiple Choice)
4.9/5 (29)
Let be the federal income tax paid based on a total taxable income of dollars. The value of is approximated by the graph in the following figure. Which of the following would represent a decrease in your income tax if your income was dollars?
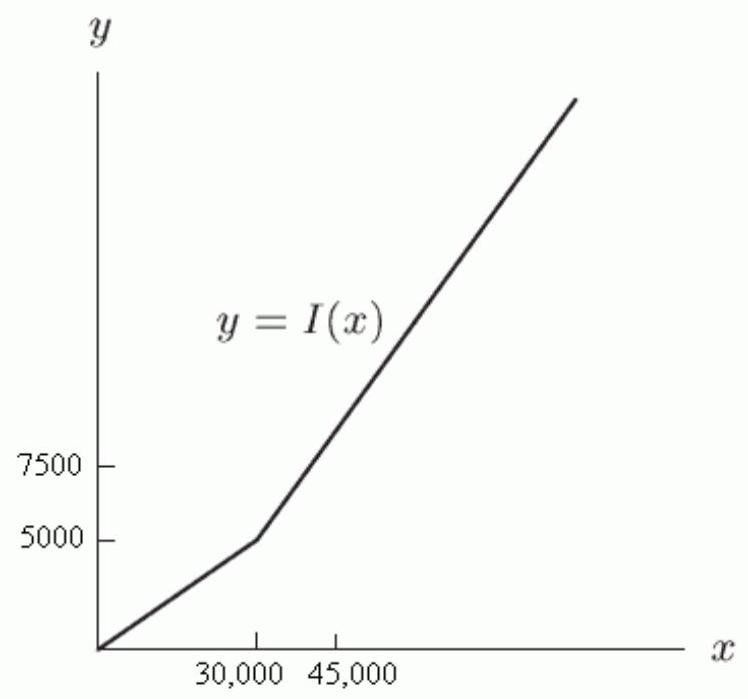
(Multiple Choice)
4.8/5 (28)
Let be defined by the following graph, and let and .
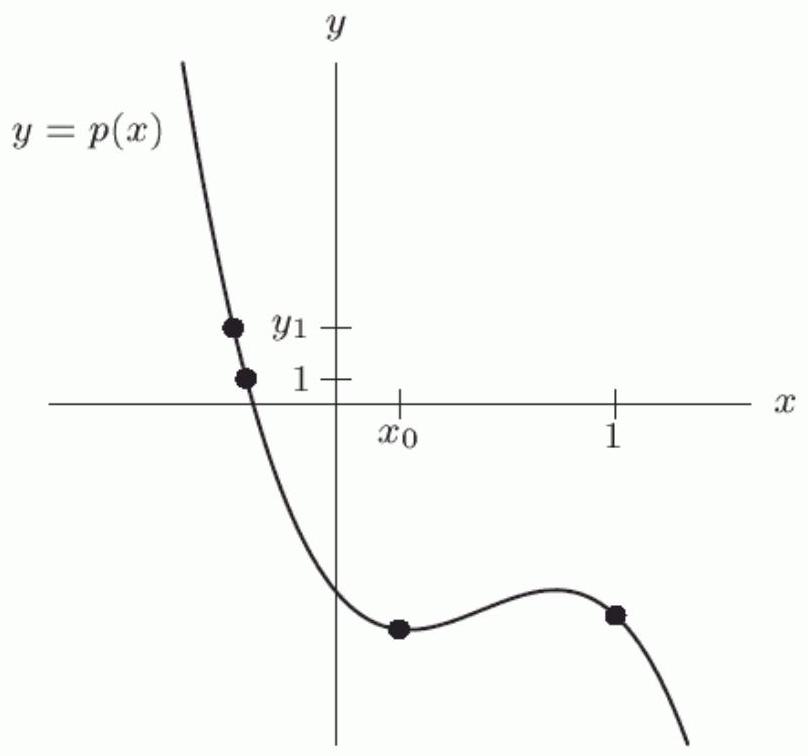 Which of the following two values is greater?
(Multiple Choice)
4.7/5 (38)
Filters
- Essay(0)
- Multiple Choice(0)
- Short Answer(0)
- True False(0)
- Matching(0)