Exam 15: More About Inference for Categorical Variables
Exam 1: Statistics Success Stories and Cautionary Tales79 Questions
Exam 2: Turning Data Into Information94 Questions
Exam 3: Relationships Between Quantitative Variables99 Questions
Exam 4: Relationships Between Categorical Variables100 Questions
Exam 5: Sampling: Surveys and How to Ask Questions109 Questions
Exam 6: Gathering Useful Data for Examining Relationships90 Questions
Exam 7: Probability112 Questions
Exam 8: Random Variables115 Questions
Exam 9: Understanding Sampling Distributions: Statistics As Random Variables231 Questions
Exam 10: Estimating Proportions With Confidence104 Questions
Exam 11: Estimating Means With Confidence103 Questions
Exam 12: Testing Hypotheses About Proportions139 Questions
Exam 13: Testing Hypotheses About Means166 Questions
Exam 14: Inference About Simple Regression115 Questions
Exam 15: More About Inference for Categorical Variables111 Questions
Exam 16: Analysis of Variance111 Questions
Exam 17: Turning Information Into Wisdom70 Questions
Select questions type
Use the following information for questions:
The table below shows the counts by gender and highest degree attained for 498 respondents in the General Social Survey. 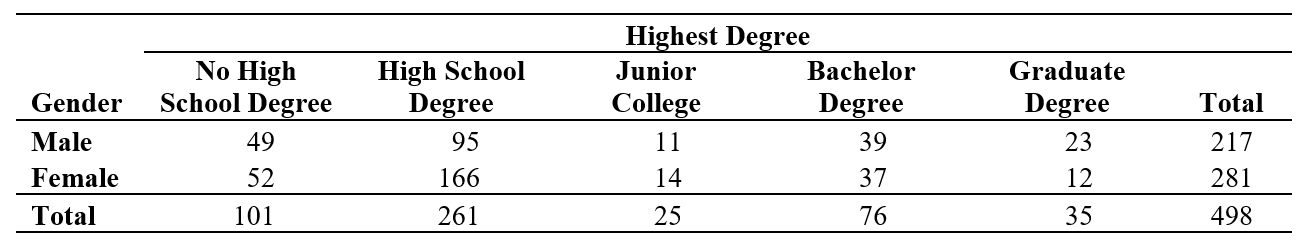 -What percentage of male respondents has more than just a high school degree?
Free
(Short Answer)
4.8/5  (25)
(25)
Correct Answer: Verified
Percentage = (11 + 39 + 23)/217 = 33.6%
Use the following information for questions:
In the General Social Survey, respondents were asked "If your party nominated a woman for President, would you vote for her if she were qualified for the job?" Minitab output for 953 respondents, by race, is shown below: 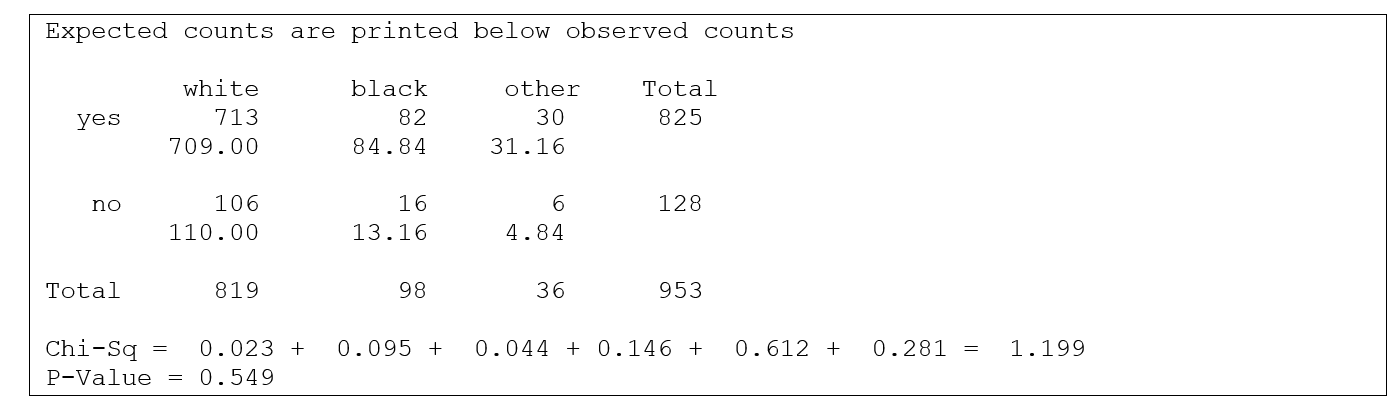 -What is the value of the test statistic?
Free
(Multiple Choice)
4.9/5 (35)
Correct Answer:Verified
B
Use the following information for questions:
A group of 3rd grade students is given a craft project to take home. Half of the children received an instruction sheet with the project that included photos of examples. The other half of the children were just given general (verbal) instructions from the teacher. At the end of the project the children were asked if they enjoyed doing the project. 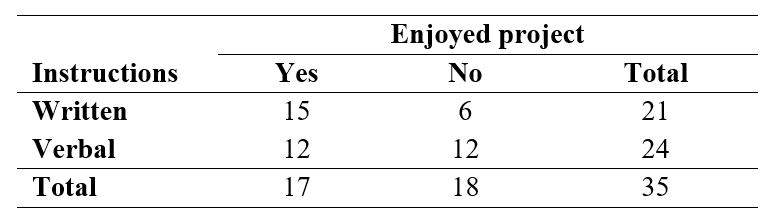 -If the null hypothesis (that there is no association between the type of instruction and the enjoyment of the children in the population) were true, what is the expected number of children in the sample who received verbal instructions and enjoyed the project?
Free
(Short Answer)
4.8/5 (30)
Correct Answer:Verified
11.66
Use the following information for questions:
A randomly selected group 78 seniors is asked about their plans after graduation. Is there a relationship between the gender of the students and what they plan to do when they graduate from college? SPSS was used to analyze the data. Part of the output is shown below: 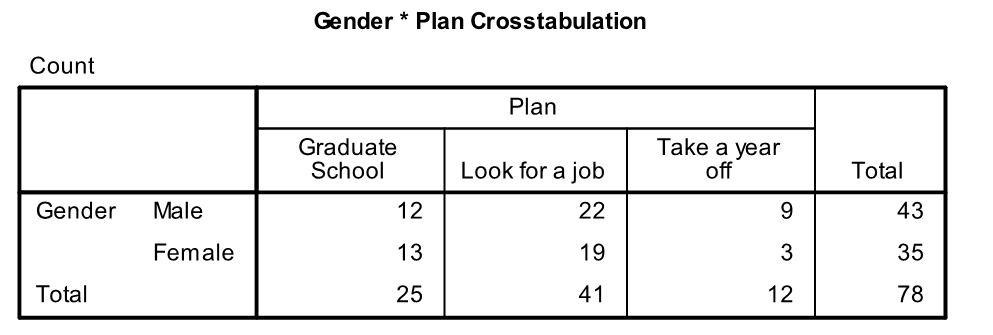 -State the null hypothesis and alternative hypotheses.
(Short Answer)
4.9/5 (31)
Use the following information for questions:
In the General Social Survey, respondents were asked "Would you approve of an adult male punching a stranger if the stranger was drunk and bumped into the man and his wife on the street?" A two-way table summarizing the results for 1006 respondents, by gender, is shown below: 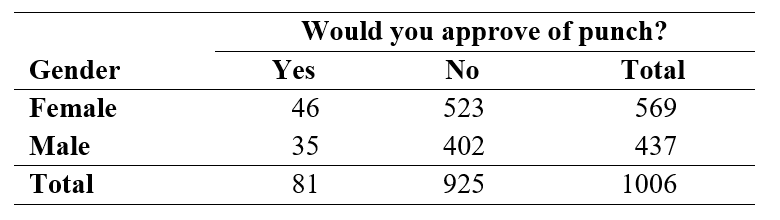 -If the null hypothesis of equal proportions of "Yes" votes for males and females were true, what is the expected number of females in the sample who think it would be all right to punch a drunken stranger?
(Multiple Choice)
4.9/5 (35)
Suppose that the chi-square statistic equals 10.9 for a two-way table with 4 rows and 2 columns. In which range does the approximate p-value fall for this situation?
(Multiple Choice)
4.9/5 (40)
Use the following information for questions:
At entrance C of the football stadium there are 3 swing gates for the spectators. On football Saturday, two high school students sit at this entrance and count the number of people who enter through each of the swing gates for an hour. On Monday, during their statistics class, they wish to determine if the percentages of people who use each of the three gates on football Saturday are equal. The data they collected during the hour on football Saturday is shown below.  -What are the null and alternative hypotheses for a chi-square goodness of fit test?
(Short Answer)
4.9/5 (32)
Use the following information for questions:
A researcher conducted a study on college students to see if there was a link between gender and how often they have cheated on an exam. She asked two questions on a survey:
(1) What is your gender? Male ___ Female ___
(2) How many times have you cheated on an exam while in college?
Never __ 1 or 2 times ___ 3 or more times ___
A two-way table of observed counts follows:
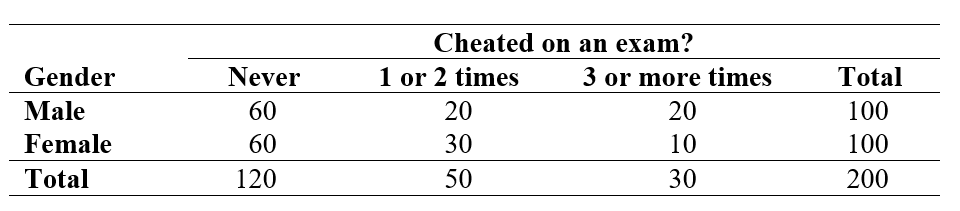 -The value of the
  -test statistic is 5.33. Are the results statistically significant at the 5% significance level?
(Multiple Choice)
4.9/5 (38)
Use the following information for questions:
A randomly selected group 78 seniors is asked about their plans after graduation. Is there a relationship between the gender of the students and what they plan to do when they graduate from college? SPSS was used to analyze the data. Part of the output is shown below:
-What are the degrees of freedom for this test?
(Short Answer)
4.8/5 (30)
Use the following information for questions:
In the General Social Survey, respondents were asked, "Do you agree with the following statement? "In spite of what some people say, the lot (situation/condition) of the average man is getting worse, not better." The results, for 989 respondents by gender, are shown below. 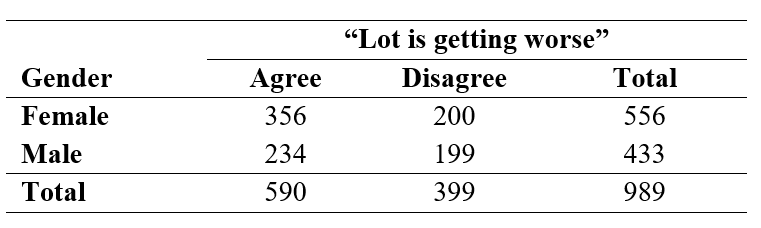 -At a significance level of 0.05, what is your conclusion?
(Short Answer)
4.9/5 (31)
Use the following information for questions:
The table below shows the counts by gender and highest degree attained for 498 respondents in the General Social Survey.
-What is the contribution to the chi-square statistic of the cell "female respondents with a graduate degree"?
(Short Answer)
4.8/5 (32)
Use the following information for questions:
In the General Social Survey, respondents were asked "If your party nominated a woman for President, would you vote for her if she were qualified for the job?" Minitab output for 953 respondents, by race, is shown below:
-What is the null hypothesis for this situation?
(Multiple Choice)
4.7/5 (40)
Use the following information for questions:
In the 1994 General Social Survey, a nationwide survey done every other year in the United States, the 1,185 respondents who had ever been married were asked the age at which they first wed and whether they had ever been divorced. The two-way table below summarizes the observed counts for the relationship between "age first wed" (categorized into four age groups) and "ever divorce" (no or yes). A chi-square value and p-value are given below the table. 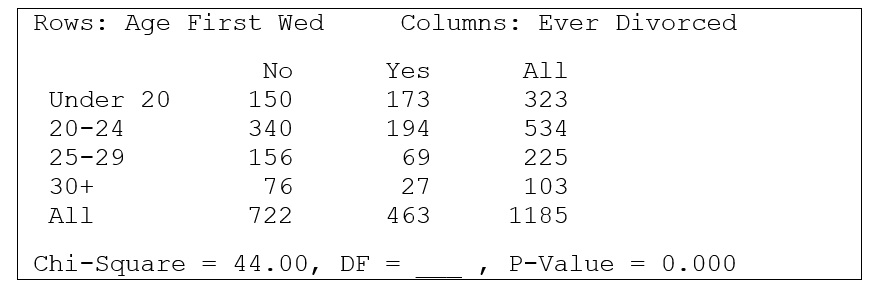 -What is the appropriate null hypothesis for this table?
(Multiple Choice)
4.8/5 (28)
Use the following information for questions:
A gambler wanted to test whether or not a die was fair. He rolled the die 180 times and got the results shown below. For example, the number "1" appeared on 40 rolls.  -If the die is fair, what is the expected number of times the number "1" should appear in 180 rolls of the die?
(Multiple Choice)
4.8/5 (38)
A medical researcher hypothesizes that, within a particular ethnic group, the distribution of blood types is: 50% have type O, 25% have type A, 20% have type B, and 5% have type AB. He gathers blood type data for a random sample of 400 people from this ethnic group, and summarizes the observed counts in the following table. 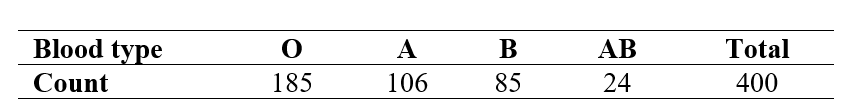 Suppose that a chi-square goodness of fit test is performed, and the null hypothesis is the researcher's hypothesis. What are the expected counts for blood types O, A, B, and AB, respectively?
(Multiple Choice)
4.9/5 (35)
Use the following information for questions:
In the General Social Survey, respondents were asked if they agreed with the following statement: "In spite of what some people say, the lot (situation/condition) of the average man is getting worse, not better." Minitab output, summarizing the results for 989 respondents by race, is shown below: 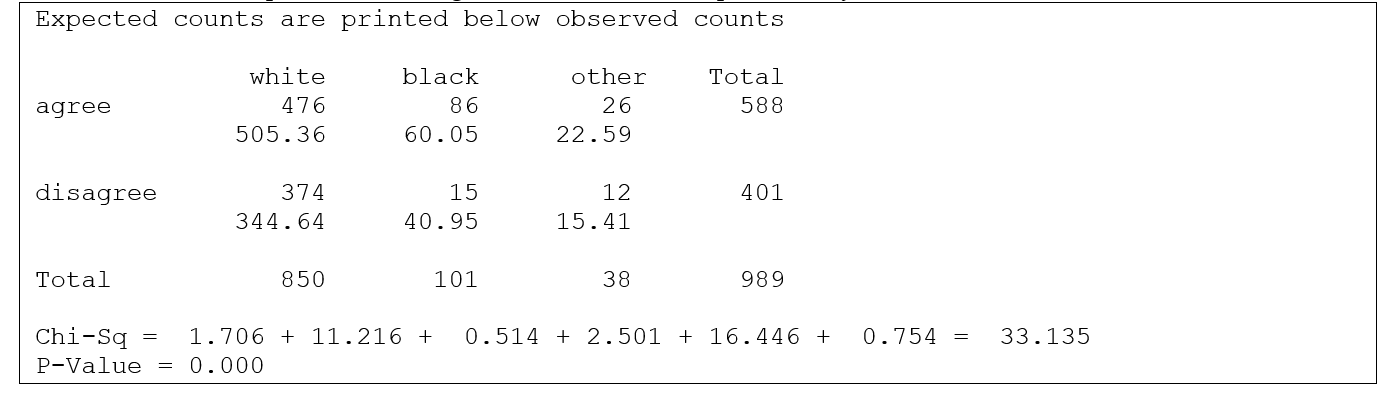 -What are the degrees of freedom?
(Short Answer)
4.8/5 (31)
Use the following information for questions:
A randomly selected group 78 seniors is asked about their plans after graduation. Is there a relationship between the gender of the students and what they plan to do when they graduate from college? SPSS was used to analyze the data. Part of the output is shown below:
-What is the expected number of female students going to graduate school under the null hypothesis?
(Short Answer)
4.9/5 (37)
Use the following information for questions:
A researcher conducted a study on college students to see if there was a link between gender and how often they have cheated on an exam. She asked two questions on a survey:
(1) What is your gender? Male ___ Female ___
(2) How many times have you cheated on an exam while in college?
Never __ 1 or 2 times ___ 3 or more times ___
A two-way table of observed counts follows:
-What are the degrees of freedom for the test statistic?
(Multiple Choice)
4.8/5 (32)
Use the following information for questions:
In the General Social Survey, respondents were asked, "Do you agree with the following statement? "In spite of what some people say, the lot (situation/condition) of the average man is getting worse, not better." The results, for 989 respondents by gender, are shown below.
-If the null hypothesis were true, what is the expected number of men in the sample who agree that the lot of the average man is getting worse?
(Short Answer)
4.8/5 (34)
Use the following information for questions:
Is there a relationship between the color of one's eyes and the comparative lengths of one's index and ring fingers? Students were asked "which finger is longer: your index finger or your ring finger? Or are they the same?" They also reported the color of their eyes (blue, brown, green, or hazel). The analysis of the results is given below. 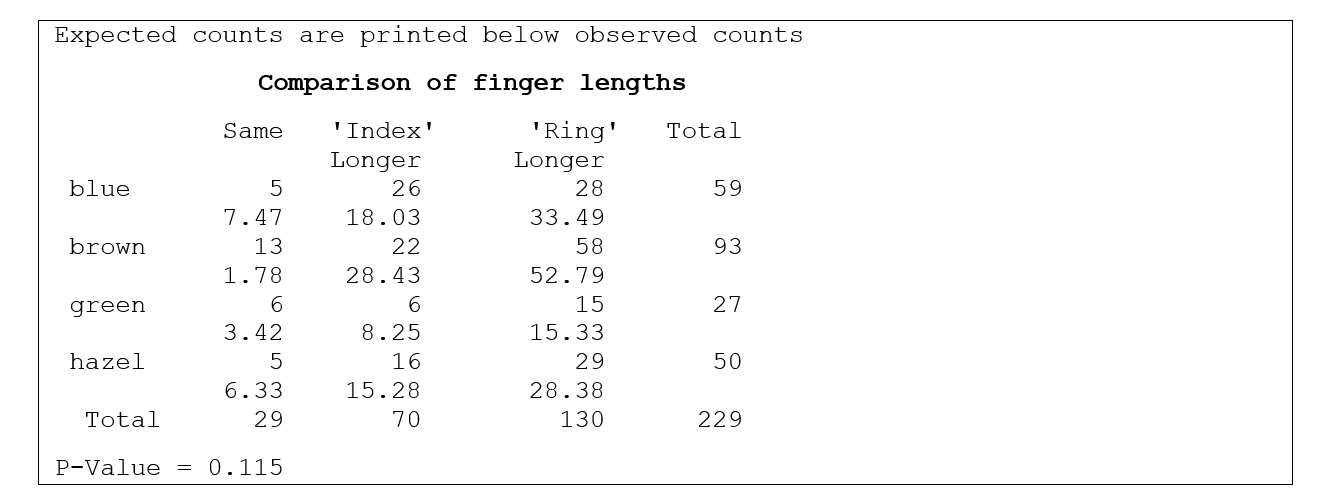 -What is the expected count for "blue eyes"and "same"?
(Multiple Choice)
4.9/5 (33)
Filters
- Essay(0)
- Multiple Choice(0)
- Short Answer(0)
- True False(0)
- Matching(0)