Exam 3: Relationships Between Quantitative Variables
Exam 1: Statistics Success Stories and Cautionary Tales79 Questions
Exam 2: Turning Data Into Information94 Questions
Exam 3: Relationships Between Quantitative Variables99 Questions
Exam 4: Relationships Between Categorical Variables100 Questions
Exam 5: Sampling: Surveys and How to Ask Questions109 Questions
Exam 6: Gathering Useful Data for Examining Relationships90 Questions
Exam 7: Probability112 Questions
Exam 8: Random Variables115 Questions
Exam 9: Understanding Sampling Distributions: Statistics As Random Variables231 Questions
Exam 10: Estimating Proportions With Confidence104 Questions
Exam 11: Estimating Means With Confidence103 Questions
Exam 12: Testing Hypotheses About Proportions139 Questions
Exam 13: Testing Hypotheses About Means166 Questions
Exam 14: Inference About Simple Regression115 Questions
Exam 15: More About Inference for Categorical Variables111 Questions
Exam 16: Analysis of Variance111 Questions
Exam 17: Turning Information Into Wisdom70 Questions
Select questions type
Use the following information for questions:
The simple linear regression equation can be written as = +
-In the simple linear regression equation, represents the slope of the regression line. Which of the following gives the best interpretation of the slope?
Free
(Multiple Choice)
4.8/5  (41)
(41)
Correct Answer: Verified
B
The equation of a regression line is called the regression equation.
Free
(True/False)
4.9/5 (37)
Correct Answer:Verified
True
A researcher found a positive correlation between the number of hours elementary school children spend watching T.V. (weekly) and their reading score on a standardized exam. What possible confounding variable could explain the observed positive correlation?
Free
(Short Answer)
4.9/5 (44)
Correct Answer:Verified
The grade or age of the children with older children (say 5th graders) watching more T.V. but would also have a higher reading score than younger children (say 1st graders).
A scatter plot and regression line can be used for all of the following except
(Multiple Choice)
4.7/5 (38)
Use the following information for questions:
A graduate student is doing a research project on stress among recent immigrants. She focused on parents of young children. All parents answered questions on a questionnaire (with the help of a translator if necessary). A stress score was calculated for all participants. SPSS was used to run a simple linear regression in which y = stress of the parent and x = age of the parent.
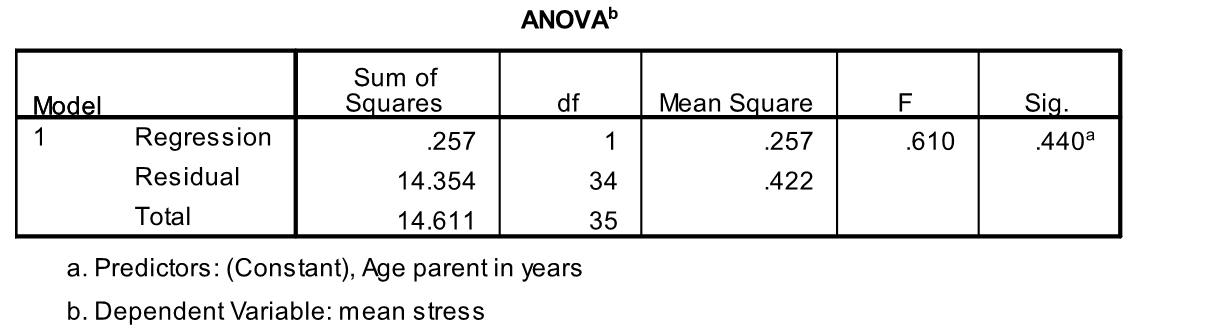
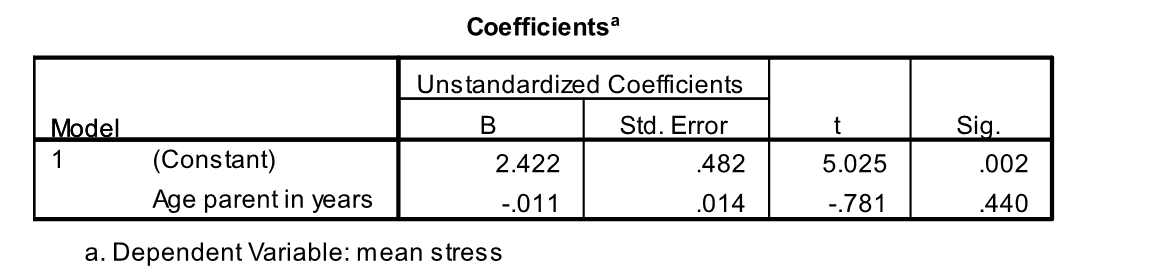 -What is the predicted stress score for a 35 year old parent?
(Multiple Choice)
5.0/5 (23)
A group of adults aged 20 to 80 were tested to see how far away they could first hear an ambulance coming towards them. An equation describing the relationship between distance (in feet) and age was found to be: Distance = 600 - 3 *Age
Based on the equation, what is the strength of the relationship between distance and age?
(Multiple Choice)
4.8/5 (50)
The correlation between two variables is given by r = 0.0. What does this mean?
(Multiple Choice)
4.8/5 (31)
Use the following information for questions:
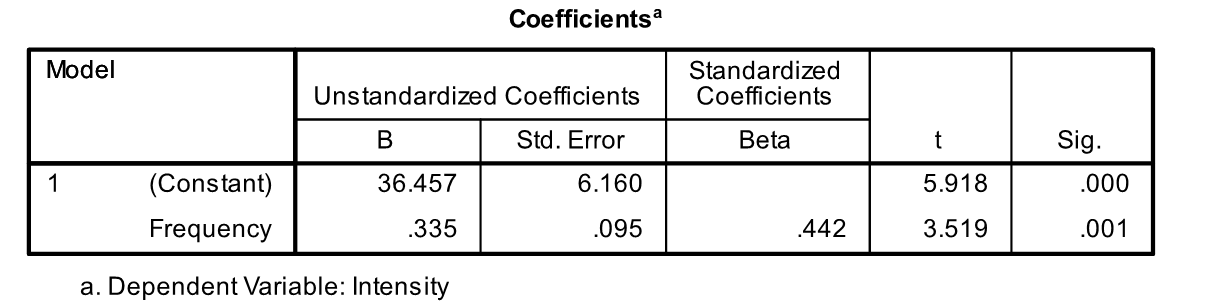
The 25 item "Parenting Hassles Scale" asks parents questions about certain situations in their family. They are asked to rate these situations on (1) how often they occur (frequency), and (2) how much they bother them (intensity). The score system for the frequency was 0-4 points (0 = never, 4 = all the time) and for the intensity 1-5 (1 = not much at all, 5 = very much). If an item received a 0 (zero) for frequency, it automatically received a 0 (zero) for intensity. The two variables, frequency and intensity, were formed by taking the total of the corresponding scores from the two rating scales across the various situations. In a scatterplot, these two variables showed an approximate linear relationship. They were then used to run a linear regression to predict intensity based on frequency.
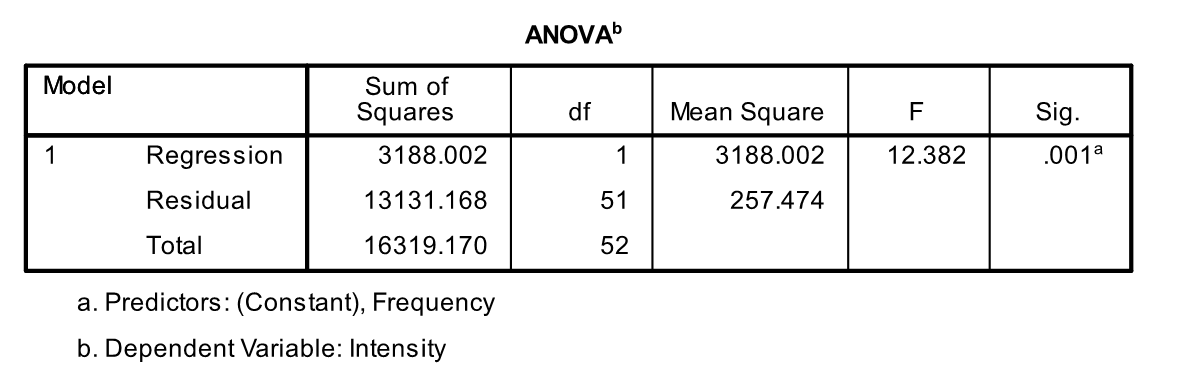
 -What is the value of the Sum of Squared Errors for this regression line?
(Short Answer)
4.8/5 (37)
The following output is for a simple regression in which y = grade point average (GPA) and x = number of classes skipped in a typical week. The results were determined using self-reported data for a sample of n = 1,673 at a large northeastern university.
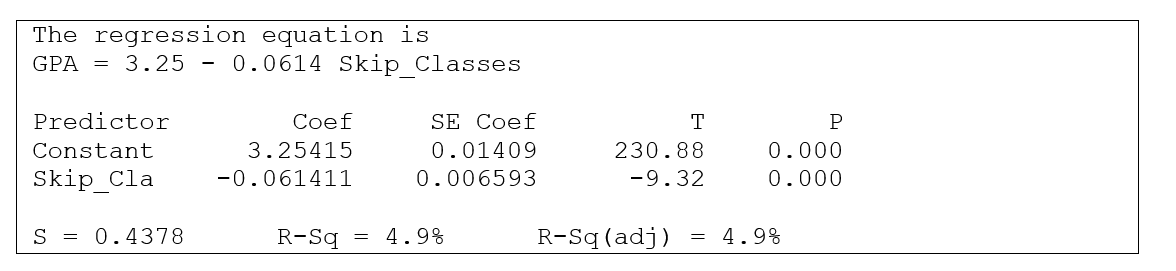 What value is given in the output for R2? Based on this value, explain whether the association between GPA and classes skipped per week is a strong association or a weak association.
(Short Answer)
4.9/5 (35)
Use the following information for questions:
A group of adults aged 20 to 80 were tested to see how far away they could first hear an ambulance coming towards them. An equation describing the relationship between distance (in feet) and age was found to be:
Distance = 600 - 3 * Age.
-How much does the estimated distance change when age is increased by 1?
(Multiple Choice)
4.8/5 (44)
The following scatterplot shows the relationship between the left and right forearm lengths (cm) for 55 college students along with the regression line, where y = left forearm length x = right forearm length. (Source: physical dataset on the CD.) 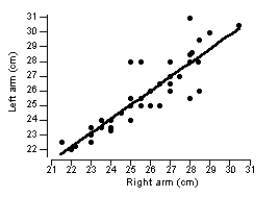 Which is the appropriate equation for the regression line in the plot?
(Multiple Choice)
4.9/5 (35)
Which of the following sets of variables is most likely to have a negative association?
(Multiple Choice)
5.0/5 (36)
A reviewer rated a sample of fifteen wines on a score from 1 (very poor) to 7 (excellent). A correlation of 0.92 was obtained between these ratings and the cost of the wines at a local store. In plain English, this means that
(Multiple Choice)
4.8/5 (38)
Use the following information for questions:
The 25 item "Parenting Hassles Scale" asks parents questions about certain situations in their family. They are asked to rate these situations on (1) how often they occur (frequency), and (2) how much they bother them (intensity). The score system for the frequency was 0-4 points (0 = never, 4 = all the time) and for the intensity 1-5 (1 = not much at all, 5 = very much). If an item received a 0 (zero) for frequency, it automatically received a 0 (zero) for intensity. The two variables, frequency and intensity, were formed by taking the total of the corresponding scores from the two rating scales across the various situations. In a scatterplot, these two variables showed an approximate linear relationship. They were then used to run a linear regression to predict intensity based on frequency.
-What is the predicted intensity score for someone who scores a 45 on the frequency scale?
(Short Answer)
4.8/5 (44)
The value of a correlation is reported by a researcher to be r = -0.5. Which of the following statements is correct?
(Multiple Choice)
4.9/5 (34)
A regression equation for left palm length (y variable) and right palm length (x variable) for 55 college students gave an error sum of squares (SSE) of 10.7 and a total sum of squares (SSTO) of 85.2. What proportion of the variation in y is explained by x?
(Multiple Choice)
4.9/5 (36)
A basketball coach of a youth team wishes to predict the number of points the players will score in their first season as a junior (y) based on the number of points they scored in their last season as youth players (x). The average number of points the team scored as youth players was =7.9 and the average number of points they scored in their first year as junior players was = 10.2. The slope is b1 = 0.79. What is the predicted number of goals for a player who scored 7 goals in his last season as a youth player?
(Multiple Choice)
4.9/5 (33)
Use the following information for questions:
The following output is for a simple regression in which y = grade point average (GPA) and x = number of classes skipped in a typical week. The results were determined using self-reported data for a sample of n = 1,673 students at a large northeastern university.
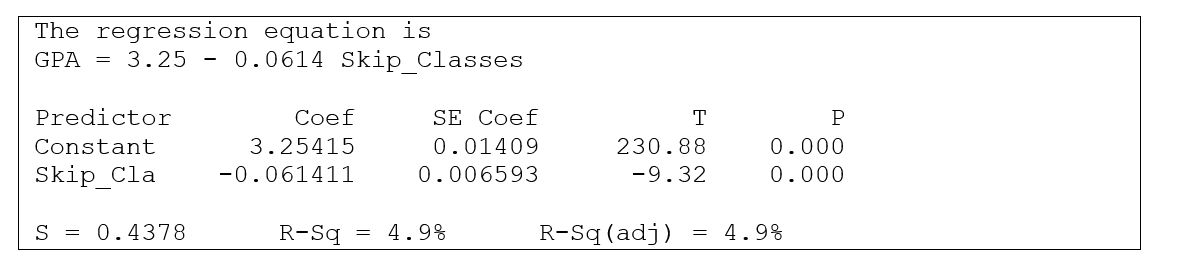 -What is the value of the slope of the sample regression line? Write a sentence that interprets this slope in the context of this situation.
(Short Answer)
4.9/5 (41)
Use the following information for questions:
The simple linear regression equation can be written as = +
-In the simple linear regression equation, the term represents the
(Multiple Choice)
4.8/5 (34)
Use the following information for questions:
A graduate student is doing a research project on stress among recent immigrants. She focused on parents of young children. All parents answered questions on a questionnaire (with the help of a translator if necessary). A stress score was calculated for all participants. SPSS was used to run a simple linear regression in which y = stress of the parent and x = age of the parent.
-Madeline is a 30-year old mother of young children who just emigrated from Germany. She scored a 1.9 on the stress test. What is the value of Madeline's residual?
(Multiple Choice)
4.8/5 (34)
Filters
- Essay(0)
- Multiple Choice(0)
- Short Answer(0)
- True False(0)
- Matching(0)